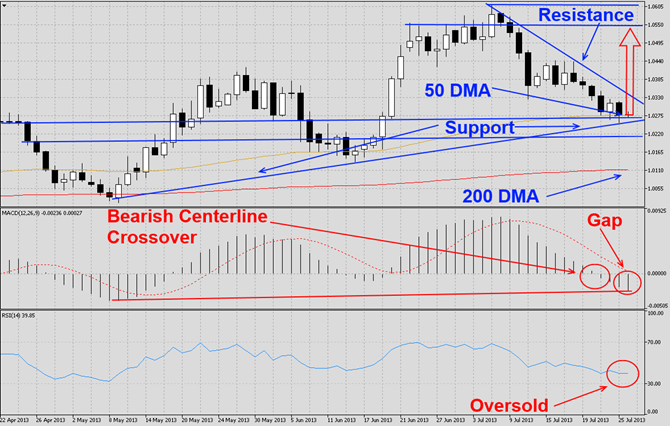

The USDCAD has corrected after it reached a multi-month high as visible in this D1 chart. This currency pair has moved lower and currently rests at solid horizontal as well as ascending support levels which are also enforced by its 50 DMA. We believe the USDCAD will attempt a rally as well as a breakout of its descending resistance level and move higher to either form a head-and-shoulders reversal pattern or a double top, both of which are bearish chart formations. MACD has completed a bearish centerline crossover which we...

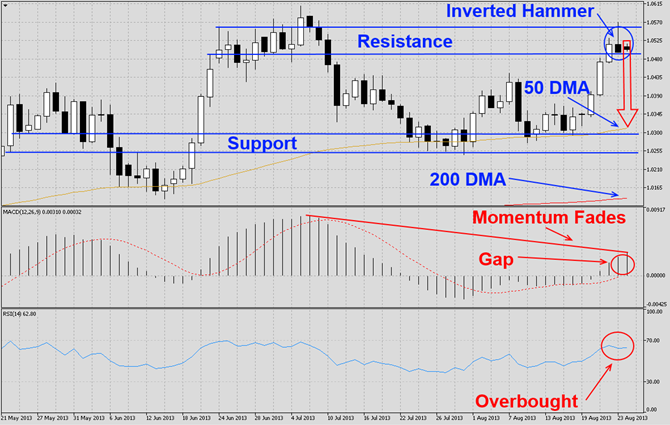
The USDCAD rallied sharply from its strong support level as visible in this D1 chart. This currency pair has now exhausted its rally as it ran into a very strong horizontal resistance zone and the top of its zone would cause the formation of a double top which is also a bearish chart pattern. Additionally we have a very solid inverted hammer candlestick which is a very bearish signal especially given its location at solid resistance levels. We expect this currency pair to correct back down to its support level, but form a higher...

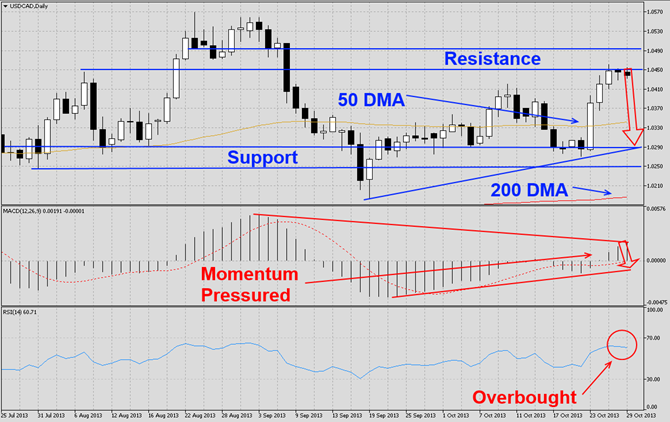
The USDCAD has rallied after briefly piercing its horizontal support level as visible in this D1 chart. This currency pair is now trading at its horizontal resistance level and should start to correct back down to its horizontal support level which is also enforced by its ascending support level. A breakdown could open the way down to its ascending 200 DMA. MACD indicates that momentum is pressured inside a triangle formation which should lead to a breakdown of momentum and potentially a bearish centerline crossover. RSI is...