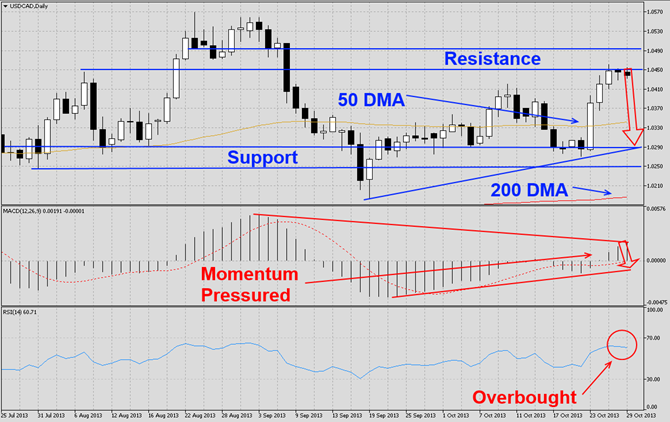
The USDCAD has rallied after briefly piercing its horizontal support level as visible in this D1 chart. This currency pair is now trading at its horizontal resistance level and should start to correct back down to its horizontal support level which is also enforced by its ascending support level. A breakdown could open the way down to its ascending 200 DMA.
MACD indicates that momentum is pressured inside a triangle formation which should lead to a breakdown of momentum and potentially a bearish centerline crossover. RSI is trading in overbought territory and a breakdown should initiate the correction.
We recommend a short position at 1.0450 with a second entry level at 1.0600. We also recommend a stop buy order at 1.0525 with a take profit target of 1.0600 in order to hedge the initial short position and before adding new short positions to this trade.
Traders who wish to exit this currency pair at a loss are advised to place their stop loss level at 1.0600. We will not use a stop loss order and execute this trade as recommended. Place your take profit target at 1.0250.
Here are the reasons why we call the USDCAD currency pair lower
- The USDCAD currency pair is currently trading at its horizontal resistance zone and we expect a correction back down to its support level
- MACD indicates that momentum is pressured inside a triangle and we expect a breakdown to occur
- RSI is trading in overbought territory and a breakdown should initiate the correction
- Profit taking after a decent rally in order to realize trading profits
- New short positions by intuitional swing traders
Open your PaxForex Trading Account now and add this currency pair to your forex portfolio.


