The Swiss KOF Leading Indicator for March was reported at 92.9. Economists predicted a figure of 85.0. Forex traders can compare this to the Swiss KOF Leading Indicator for February, which was reported at 100.9. US Pending Home Sales for February are predicted to decrease by 2.0% monthly and to increase 6.0% annualized. Forex traders can compare this to US Pending Home Sales for January, which increased by 5.2% monthly and 6.7% annualized. The US Dallas Fed Manufacturing Activity Index for March is predicted at -10.0. Forex traders can compare this to the US Dallas Fed Manufacturing Activity Index for February, which was reported at 1.2.
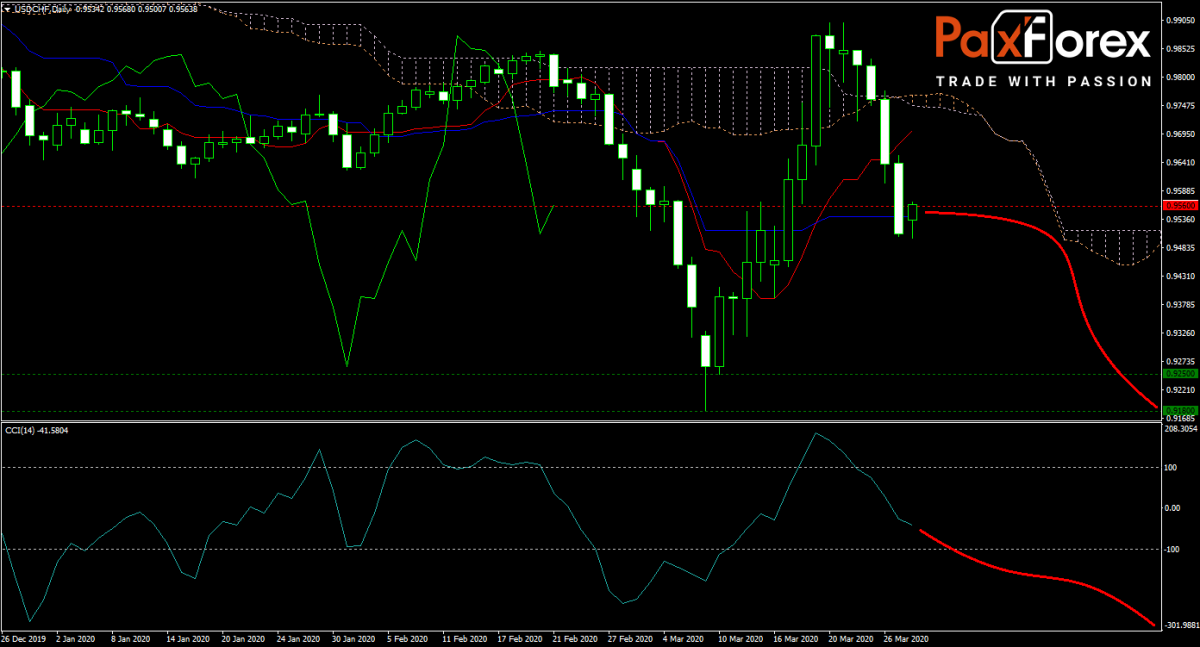
The USD/CHF is caught in a sell-off as forex traders adjust their positions following the US Federal Reserve’s open-ended QE program. US President Trump signed the $2 trillion stimulus package last Friday, but economic data will be front-and-center. The forecast for price action remains bearish, but will bulls attempt to force a reversal? Subscribe to the PaxForex Daily Fundamental Analysis and earn over 5,000 pips per month.

Should price action for the USD/CHF remain inside the or breakdown below the 0.9500 to 0.9600 zone the following trade set-up is recommended:
- Timeframe: D1
- Recommendation: Short Position
- Entry Level: Short Position @ 0.9560
- Take Profit Zone: 0.9180 – 0.9250
- Stop Loss Level: 0.9655
Should price action for the USD/CHF breakout above 0.9600 the following trade set-up is recommended:
- Timeframe: D1
- Recommendation: Long Position
- Entry Level: Long Position @ 0.9655
- Take Profit Zone: 0.9715 – 0.9775
- Stop Loss Level: 0.9600
Open your PaxForex Trading Account now and add this currency pair to your forex portfolio.


