The Chinese Non-Manufacturing PMI for May was reported at 53.6 and the Chinese Manufacturing PMI at 50.6. Economists predicted a figure of 42.0 and 45.0. Forex traders can compare this to the Chinese Non-Manufacturing PMI for April, which was reported at 53.2 and to the Chinese Manufacturing PMI, which was reported at 50.8. The Chinese Composite PMI for May was reported at 53.4. Forex traders can compare this to the Chinese Composite PMI for April, which was reported at 53.4.
The Australian AiG Performance of Manufacturing Index for May was reported at 41.6. Forex traders can compare this to the Australian AiG Performance of Manufacturing Index for April, which was reported at 35.8. Australian TD Securities Inflation for May decreased by 1.2% monthly. Forex traders can compare this to Australian TD Securities Inflation for April, which decreased by 0.1% monthly. The Chinese Caixin Manufacturing PMI for May was reported at 50.7. Economists predicted a figure of 49.6. Forex traders can compare this to the Chinese Caixin Manufacturing PMI for April, which was reported at 49.4.
The Final US Markit Manufacturing PMI for May is predicted at 39.8. Forex traders can compare this to the previous US Markit Manufacturing PMI for April, which was reported at 36.1. US Construction Spending for April is predicted to decrease by 6.0% monthly. Forex traders can compare this to US Construction Spending for Match, which increased by 0.9% monthly. The US ISM Manufacturing Index for May is predicted at 43.0. Forex traders can compare this to the US ISM Manufacturing Index for April, which was reported at 41.5. ISM Prices Paid for May are predicted at 37.0. Forex traders can compare this to ISM Prices Paid for April, which were reported at 35.3. ISM Employment for May is predicted at 35.0. Forex traders can compare this to ISM Employment for April, which was reported at 27.5.
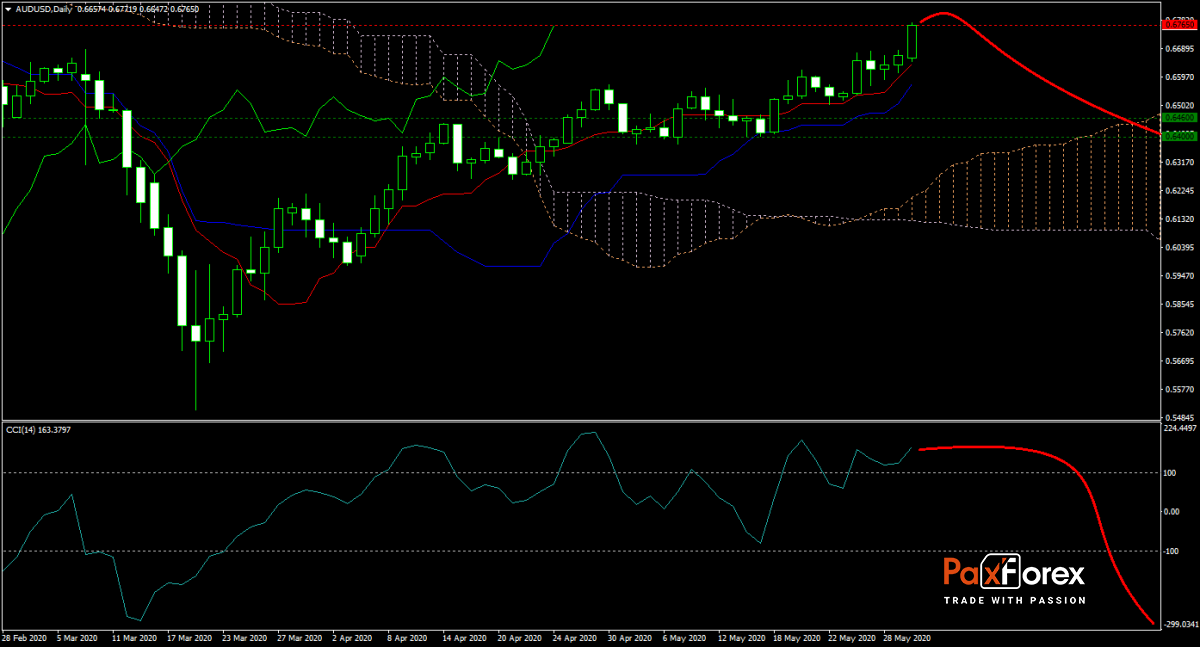
The AUD/USD forecast adopted a bearish bias with the CCI moving lower while price action extended its rally. Chinese manufacturing data was weaker than expected, followed by Australian economic disappointments. Forex traders now look forward to the US ISM Manufacturing Index, where more weakness is anticipated. This currency pair is exposed to a correction into its Ichimoku Kinko Hyo cloud, which coincides with a horizontal support area. Subscribe to the PaxForex Daily Fundamental Analysis and earn over 5,000 pips per month.

Should price action for the AUD/USD remain inside the or breakdown below the 0.6700 to 0.6800 zone the following trade set-up is recommended:
- Timeframe: D1
- Recommendation: Short Position
- Entry Level: Short Position @ 0.6765
- Take Profit Zone: 0.6400 – 0.6460
- Stop Loss Level: 0.6820
Should price action for the AUD/USD breakout above 0.6800 the following trade set-up is recommended:
- Timeframe: D1
- Recommendation: Long Position
- Entry Level: Long Position @ 0.6820
- Take Profit Zone: 0.6875 – 0.6920
- Stop Loss Level: 0.6765
Open your PaxForex Trading Account now and add this currency pair to your forex portfolio.


