
Bollinger Bands® is one of the most famous indicators. Developed in the last century, at the moment this algorithm is not only presented in the set of indicators already included in almost every trading terminal but also often becomes the basis for new developments, acting as a basic algorithm. Today with this article we will learn what is the Bollinger Bands®, will discover some trading strategies implementing this indicator. So, make yourself comfortable, we are getting started.
What is the Bollinger Bands®?
The Bollinger Bands® indicator is a classical trend indicator, which determines the price location relative to its standard trading range. Unlike other instruments based on similar principles, it can measure not only the direction of price movement but also its speed.
Bollinger Bands® is positioned as a trend indicator, but many people consider it an indicator of volatility. Of course, the chart itself is primary, the algorithm only processes numerical data and shows the state, which can already be estimated by eye, but the beauty of Bollinger Bands® is that the information is presented in a very convenient graphical form, it allows you to quickly assess the scale of fluctuations, structure, and dynamics. Many trading systems in one form or another use this simple and convenient indicator, and for some, it is the basis.
The Bollinger Bands® chart shows three lines. The first one is an ordinary moving line, which is responsible for the main purpose of the indicator - to show the trend. This is one of the easiest ways to determine the current trend - where the line is directed, that is where the market is moving. The lag effect can be reduced as much as possible due to the competent selection of such a parameter as the period, for each currency pair and the time frame you need to look for your values. But all this is relevant only when the specified line is used as a trend indicator, many traders ignore this possibility and prefer to use the Bollinger Band indicator in another way - to estimate the price deviation from the average values. For this purpose, the indicator provides two more lines, which are on opposite sides of the moving average. Their readings are based on the standard deviation, which makes it possible to estimate the price change from the previous values within this simple mathematical formula.
To some extent, it may resemble a normal shift of a simple moving average by some value on the price scale, expressed as a percentage. But unlike a fixed value, Bollinger Bands® are dynamic, they narrow down when volatility decreases, and on the contrary, expand when it increases. This makes it possible to estimate the state of the market, and the sensitivity of this method is much higher than even for linear-weighted moving.
Forex Trading With PaxForex
If you're looking for a reliable broker with the best trading conditions, you`ve got to the right place! Trading with PaxForex you will access the wide range of markets, including currencies, shares, and more. Apart from that, you are liable to the leverage of up to 1:500 and the spread from 0.4 pips.
The security of client funds is ensured by their storage on segregated accounts, separately from the company`s funds. With the 4 types of accounts offered, there is something that will suit your style and financial goals, you can be sure. Open a live account and discover all the beauty of trading with PaxForex.
Interpreting Bollinger Bands®
The indicator consists of three stripes (bands):
the middle band is a usual moving average.
the upper band is a moving average + 2 standard deviations
the lower band is a moving average - 2 standard deviations
The smaller this parameter is, the more signals are generated. Increasing the period limits the number of messages, but also significantly improves their quality. If you want to reduce the standard deviation 2, you should consider that although a narrow channel is penetrated more often, many of these breakdowns generate false signals.
The Bollinger Bands® `s interpretation is based on the fact that prices tend to remain within the upper and lower limits of the band.
At a time when the market is highly volatile, Bollinger Bands® expand and as if give a room for prices.
In the period of low volatility Bollinger Bands® narrow and keep prices within their boundaries.
The following features of this indicator are highlighted:
Having reached one of the boundaries, the price is very likely to go to the opposite boundary. This property allows the trader to roughly estimate the future range of price movement.
Narrowing and widening of bands indicate the change in price volatility. Bands narrow with decreasing volatility and widen when it increases. Besides, the price has a feature that after a long movement in a narrow corridor (with low volatility), it sharply leaves it with an avalanche-like growth of volatility. Thus, you can use the Bollinger Bands as an indicator of price volatility at the current moment, as well as a benchmark for placing pending orders on both sides of the border (in order not to miss the upcoming large price movement).
The exit of the price outside the bands indicates the strength of the current trend. Thus, crossing the upper boundary can serve as a signal to buy, and crossing the lower boundary - as a signal to sell. However, if the price returns to the range after exiting it and then forms another extremum in it, it indicates the current trend reversal rather than a continuation.
And, finally, the last case - relatively wide and, most importantly, approximately homogeneous in width channel from Bollinger bands indicates that the market is in a relatively large lateral correction and the next round of trend movement should take place. The trades should be opened only in the direction that is currently present in the market. For example, if trading is carried out according to the hourly chart, it is better to look at the trend on the four-hour chart.
Bollinger Bands® is a trend indicator that shows the state of the market at a particular moment.
For example, if the bands do not move in parallel for a long period of time, it means that the flat state prevails. As soon as this position begins to change, you should prepare for the appearance of a powerful trend.
Advantages of Bollinger Bands® Indicator

The attractiveness of Bollinger Bands® for traders lies in two very important characteristics. First off, the Bollinger Bands® shows the main trend/side-axis axes in the same way as price or moving averages do. Secondly, they narrow and widen as they move. And the interaction of the mentioned properties of Bollinger Bands® determines the unique models as the price bars, developing their movement, pass through these or those boundaries. Japanese candlesticks work especially well with Bollinger Bands®. Thus, for example, doji candlestick, which collides with narrowing bands, gives an effective signal for short-term price reversal.
Bollinger Bands® reacts to the price movement with their bends and turns. These wave-shaped movements predict how far the trend can spread before the forces of distribution return it to the central axis. A complex set of interactions develops between price/band direction and price/band narrowing. Very much practical experience is required to identify the final impact of these bands on price. But, having spent dozens of hours watching this indicator, you will not spare the efforts made. Bollinger Bands® indicates the hidden nature of price fluctuations is much better than many other instruments, and immediately let you know if the same cherished door, behind which the profits are lurking, is opened or locked.
Daily Trading with DBBs (Double Bollinger Bands®)
The Double Bollinger Band® strategy has a wide range of implementations but provides the greatest value in evaluating the momentum and volatility of price actions. It allows traders to accurately determine the entry and exit points, as well as when a trend is keeping or losing momentum.
The Double Bollinger Band ® strategy uses two Bollinger Bands® to filter the entry and exit levels. The strategy is focused on entering long (short) positions when the price breaks out (or down) one standard deviation. The strategy can be used in ranging markets, as a breakout strategy, or when evaluating the momentum/slowing down of an existing trend.
Insert the following indicators to the chart of the asset you are going to trade:
Default Bollinger Band® (20 2). The first number refers to the simple moving average and the second, to the number of standard deviations from the mean/average.
A second Bollinger Band® (20 1). Choose the default 20 SMA, only now set parameters with one standard deviation.
First off, prior to going through the strategy itself, we have to get the hang of how to read the chart following since a lot of things need to be taken into account.
Analyzing the chart is most comfortable to do by beginning in the middle and moving outwards. The dotted line in the middle is the moving average. Then moving out in both directions, the green and red lines designate the single standard deviation, while the external lines (shown in black) outline the two standard deviations.
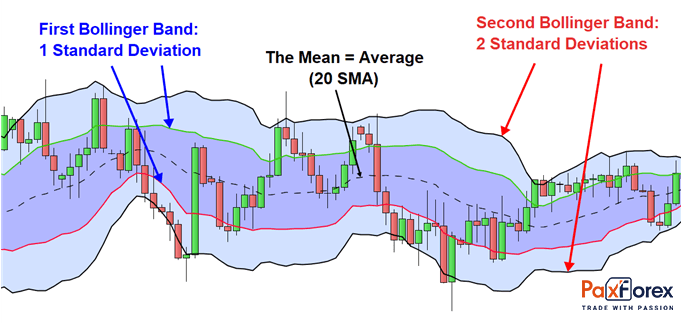
If we refer to statistics, 95% of the noted candles should be included within the two standard deviations, suggesting that traders will observe price moving within or across the different sections, triggering multiple signals.
Also, we should keep in mind that the Double Bollinger Band® strategy consolidates three distinctive zones.
Double Bollinger Band® (DBB) Buy Zone: You can see it as the light blue section among the first standard deviation and the double standard deviation that is located above the 20 SMA. It shows us that the uptrend is strong and the price is more likely to continue rising.
DBB Neutral Zone: This one is shown as the purple area between the upper and lower, single, standard deviation. Here price action hints us that the market is changeable and requires a directional bias. It is recommended, especially for trend traders, to evade placing new orders in this zone. This zone usually indicates a slow- down in momentum or the start of a ranging market.
DBB Sell Zone: It is shown as the light blue area between the single standard deviation and the double standard deviation that is located below the 20 SMA. Indicates a sell signal.
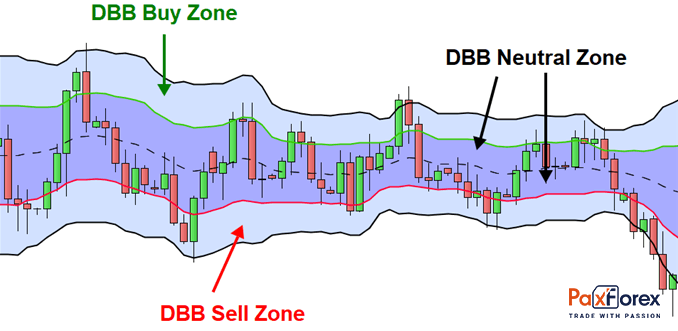
Basically, in case the price is in the uppermost zone, you should place a BUY order, if it's in the lower zone, go for a short position. If the price is in the neutral zone, it is better to avoid trading or trade shorter-term trends inside the current trading range. By the way, traders use high time frames, like H4, or implement this strategy in terms of day trading.
Bollinger Bands® Scalping
In Bollinger Bands® scalping strategy we will use several indicators: Bollinger, RSI, Stochastic, and MA. Despite the large number of instruments for analysis, the signals received are simple and easy to read. As we remember, scalping implies short trade lifetime, and it is the signals from the chart that are very important for determining the short-term trend and getting a quick profit.
For trading we will need the following indicators:
Bollinger Bands® - period 50, deviation 2, the color yellow.
Bollinger Bands® - period 50, deviation 3, color blue.
Bollinger Bands® - period 50, deviation 4, color red.
RSI - period 8, levels 30 and 70.
Stochastic - parameters 14, 3, levels 20, and 80.
MA - period 50 (center green line).
Considering that we are going to scalp, the time interval should not be above M1 or M5.
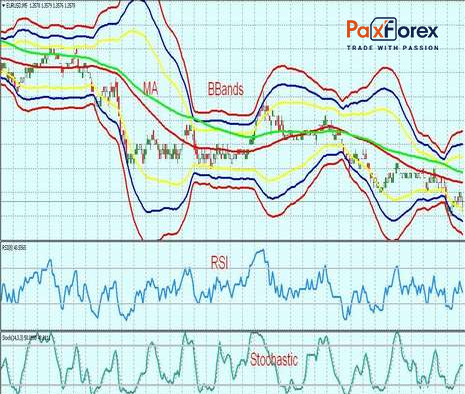
The rules for opening the position:
The buy signal is the price breaking down the yellow channel from top to bottom and passing at least half the distance to the lower blue BB. The price should pullback presumably to the green line MA (50), where the profit is fixed. Additional signals are reaching or breaking through level 30 by the RSI indicator. The Stochastic is located below level 20.
A sell signal is a price penetrating the bottom of the upward yellow channel and passing at least half of the distance to the upper blue BB. The price should pullback presumably to the green line MA (50), where we get the profit. Additional signals are reaching or breaking through level 70 by the RSI indicator. The Stochastic is located above level 80.
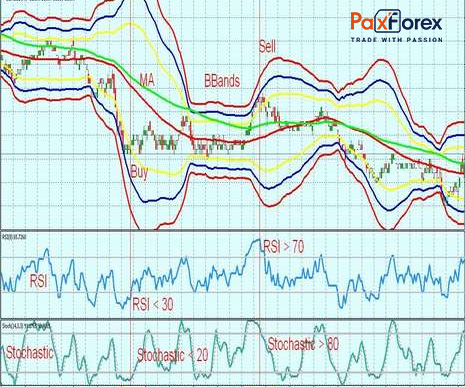
Please note that it is possible to enter into a trade both after the price reaches the blue line, and at the moment of price pullback from the blue to the yellow line.
It is up to the trader to decide when to close the position. It can be done when the green MA is reached, or you can wait for confirmation from oscillators RSI and Stochastic.
Each currency pair has its own volatility and the nature of price movements. In other words, when trading with a strategy based on the Bollinger Bands®, you need to change, optimize the trading parameters for a specific instrument.
Let's say, we can wait for the price movement not towards the blue, but the red Bollinger line. Not only the entrance is important, but also the moment when it is necessary to close the position. This requires practice, to be more precise, testing. This scalping strategy after optimization for a specific currency pair shows no more than 20% drawdown on backtests, profit more than 20% per month.
Two Advanced Bollinger Bands® Strategies For Professional Traders
- Strategy 1: Bollinger Band Breakout Strategy
Bollinger Band Breakout is a simple forex trading strategy that is easy to understand. This strategy uses market volatility, support, and resistance levels. It uses a price structure, not a moving average.
As we have mentioned, Bollinger Bands® measures market volatility. When estimating price movements, a breakout of the upper or lower band serves as an indicator of increased market volatility. If such a breakout and price movement are seen at the right time, it may give an advantage in trading for profit. rice movement and price moment are the criteria that must be considered.
The moving average can be used as an indicator of the current short-term market trend. According to the very idea of the Bollinger Bands® trading strategy, in which direction the band is interrupted (resistance level/support level), the position should be opened in the same direction.
How to trade with the Bollinger Bands® Breakout Trading Strategy
You can be a day trader or trade on fluctuations. It all depends on the personal choice of the trader.
You can use any time frame you like, however, here are some recommendations:
You can use a one-hour chart, but keep the expected profit according to a lower fluctuation potential.
The four-hour charts are a great compromise between daily trading and trading on fluctuations, in Forex there are many periods when the volatility is very low. For example, during the Asian session, very often the bands come close to each other.
Daily charts are interesting to look at, as they show a lot of independent types of movement.
The choice of currency pairs depends on the trader, but it is important to consider that some pairs move more than others. It is better to stick to more popular currency pairs while studying Bollinger Bands® strategy.
When using the Bollinger Bands® indicator, we set the following settings: 20 for the moving average and 2 for the standard deviation.
Trading Rules:
The price crosses the support or resistance level.
The candlestick closes outside the top or bottom Bollinger band before or after a support/resistance breakout.
You may decide for yourself that to confirm the price you need two touches of the horizontal trend line and the support or resistance line. Of course, in a lower time frame, you will receive more tested confirmations.
On a daily chart, you can study individual points of price direction change, which may be support or resistance. This is why you need to make sure that the price has been at this level twice before taking a certain level as significant.
Stop Loss and Targets
You can either use an ATR stop (Average True Range) or simply place a Stop Loss below the setting candle to buy or above it to sell.
Targets can be a multiple of your risk or targets. You can also use an indicator that is appropriate for your target and takes into account the target yield.
Why use this method?
Bollinger Bunds normalizes price volatility by calculating the standard deviation. When the price exceeds the upper or lower band, we can assume that a new movement has started, which has a certain driving force. The inclusion of support and resistance levels in the analysis can help to indicate price points important for trading.
- Strategy 2: Counter - Trend Trading Indicator Strategy
Trading Against Trend is an intra-day strategy that trades on highs or lows based only on recovery following a strong movement.
Market: Forex;
Currency pairs: Any;
Time frame: H1;
Indicators: RSI, Bollinger Bands®;
Protecting Orders: Breakeven, Take Profit.
This strategy is based on intraday reversal and uses a combination of three Bollinger Bands® and Relative Strength Index (RSI) on H1 charts. Trading starts when the RSI shows an oversold or overbought level. Overbought is defined as RSI > 70, and oversold is RSI < 30. This is a signal to start tracking a possible reversal.
However, instead of immediately buying at the top of the trend reversal based solely on the RSI, we will add a set of 3 Bollinger Band indicators to determine the "depletion point". The reason we use the 3 indicators is that they help us measure the extreme point of movement together with the scale of possible recovery.
In our strategy, we will add the 3rd Standard Deviation of Bollinger Bands® (SDBB) indicator. If the price touches the third indicator from either side, we will know that this movement has a 5% probability, which characterizes it as exceptional. When the movement from the 3rd Bollinger indicator enters the zone between the 1st and 2nd SDBB, we know that at that moment the currency pair reached its extremum and is entering the reversal phase. In conclusion, we should make sure that at least one candlestick has closed completely in the zone between the 2nd and 1st indicators. This last rule will help us to track "false" movements and make sure that the previous movement has really "exhausted". It is a strategy with low risk and low profitability for those who like to scalp and take small profits. The strategy is applied only on the hourly charts.
Counter-Trend Strategy rules
How and when to buy:
Check if the RSI is less than 30.
Confirm that the price has broken through the 3rd SDBB indicator.
On the hour chart, we wait for candlestick movement from the zone between 3rd and 2nd SDBB to the zone between 2nd and 1st.
After full closing of the candle in the zone 2-1, place a buy order.
We set a Stop Loss at the level of the minimum price minus 10 points.
The first target for half a position is the amount we risk; then we move the stop to breakeven.
The second target is the upper limit of the 2nd SDBB indicator.
How and when to sell:
Check if the RSI is more than 70.
Wait for the price to break through the 3rd SDBB indicator.
On the hour chart, we are waiting for the candle to move from the zone between the 3rd and 2nd SDBB to the zone between the 2nd and 1st SDBB.
After full closing of the candlestick in zone 2-1, go short.
We set a Stop Loss at the maximum price level plus 10 points.
The first target for half the position is the amount we risk; then move the stop to breakeven.
The second target is the lower limit of the 2nd SDBB indicator.
The example of implementing the Counter - Trend Trading Indicator Strategy
The first example shows the hour chart of EUR/USD. The pair starts its movement, having made a small drop, and here our "radar" triggers: around 13:00, the RSI indicator shows a value below 30 (Step 1). We look at the Bollinger Bands® and see that the price also breaks out the 3rd indicator and starts trading between the 3rd and 2nd SDBB.
We closely monitor the full closing in the area between 2nd and 1st SDBB and at that time we buy (Step 2). Our trading starts at 18:00 and we place a long position at 1.4165. We immediately place our stop order at 1.4125 (chart minimum), risking 40 pips in a trade.
Since the profit from our first fixing the profit is the amount we are risking, we place an order to close half of the position at 1.4205. The order triggers three hours later. We move the Stop Loss to breakeven and are preparing to sell the second half when the price breaks down the upper limit of the 2nd SDBB. The rest of the position could have been closed at 1.4300 eventually.
The GBP/USD chart is another example of a short position against the trend. Here we observe the GBP/USD pair trading in a narrow range. The dollar starts to sell out after 9:00 am (after some news) and in the next 9 hours GBP/USD skyrockets.
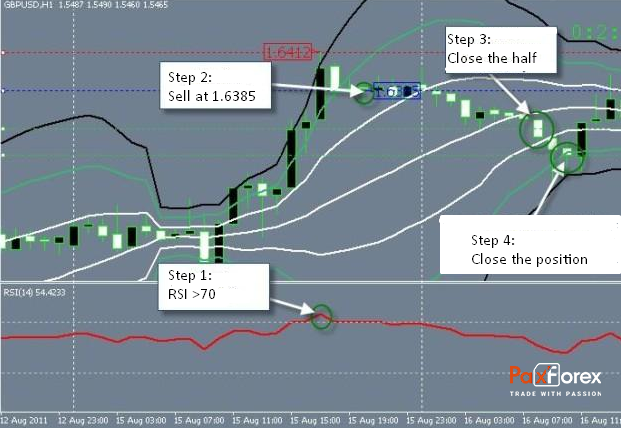
The currency pair reached our "radar" the day the RSI goes of 70 (Step 1). We find out that the price also penetrates the top of the third band and start looking for a short position when we see the bar close completely between the 3rd and 2nd standard deviation of Bollinger Bands®. It happens at 19:00 and we place the SELL order when we open the next bar at 1.6385 (Step 2).
We place a stop at the high of 1.6412, risking 27 pips. The target for the first half of the position is the entry point minus the number of pips we are risking - 1.6358 (Step 3). After we enter the position, GBP/USD starts to sell out gradually and our Take Profit triggers at 8:00 AM the following day. The price touched the boundary of the 2nd SDBB and we reached 1.6440 (Step 4), earning 45 pips.
Entering a trade at high or low without the support of the indicators is the way to defeat. A counter-trend strategy is an intraday strategy that enters into highs or lows based on a net recovery following a strong movement. It does not tolerate thoughtless implementation but skillfully used, can be a profitable strategy for forex traders.
Tips for Bollinger Band® Trading
We can also make use of the Bollinger Bands® in order to define price patterns like M-tops and W-bottoms, shifts in momentum, etc.
Taking into account that the pre-defined settings for the moving average line are '20 periods', which sets the background for the standard deviation calculations, of which two standard deviations form the bandwidth as the defaults. These settings are to be adjusted following the market and asset traded.
The Bollinger Bands® indicator shows relative highs and lows of the price.
There is no need to employ the trend and volatility when you want to confirm the price action since they have already been laid down on the basis of the Bollinger Bands®.
A reversal candlestick on the bands may indicate an inability of the price to breakthrough and potential reversal.
Do not make any suggestions derived from the application of the calculation of the standard deviation in the construction of the bands. The sample size in most deployments of the Bollinger Bands® is just not big enough to be statistically meaningful.
The Bollinger Bands® indicators can be normalized with the help of % b, by excluding fixed cut-off values in the process.
The relative determination can be applied to differentiate price and indicator actions, to succeed at making accurate and informed decisions to place BUY/SELL orders.
The price of the asset can lead up the top Bollinger Band® and down the lower Bollinger Band®.
As per John Bollinger himself, tags of the bands are just tags, not signals. A touch of the upper Bollinger Band® shouldn't be interpreted as a signal to sell. The same refers to a touch of the lower Bollinger Band®. It should not be accepted as a command to buy.
The implemented indicators should not be closely interrelated with each other.
A candlestick closed outside the Bollinger Band initially indicates a potential breakthrough, which in turn may lead to the continuation of the trend and not to its reversal.
A simple moving average is at the core of the Bollinger Bands®. That is because a simple moving average is applied in the standard deviation calculation.
Sharp changes in prices usually occur after a narrowing of the band, corresponding to a decrease in volatility.
If peaks and troughs outside the band are followed by peaks and troughs inside the band, a trend reversal is possible.
Price movements starting from one of the band's boundaries usually reach the opposite boundary. The latter observation is useful for projecting price targets.


