The Australian AiG Performance of Manufacturing Index for March was reported at 53.7. Forex traders can compare this to the Australian AiG Performance of Manufacturing Index for February, which was reported at 44.3. The Final Australian CBA Manufacturing PMI for March was reported at 49.7. Economists predicted a figure of 50.1. Forex traders can compare this to the previous Australian CBA Manufacturing PMI for March, which was reported at 50.1. Japanese Loans & Discounts for March increased by 2.36% annualized. Forex traders can compare this to Japanese Loans & Discounts for February, which increased by 2.20%.
The Tankan Large Manufacturers Index for the first quarter was reported at -8. Economists predicted a figure of -10. Forex traders can compare this to the Tankan Large Manufacturers Index for the fourth quarter, which was reported at 0. The Tankan Large Manufacturers Outlook for the first quarter was reported at -11. Economists predicted a figure of -15. Forex traders can compare this to the Tankan Large Manufacturers Outlook for the fourth quarter, which was reported at 0. The Tankan Large Non-Manufacturers Index for the first quarter was reported at 8. Economists predicted a figure of 2. Forex traders can compare this to the Tankan Large Non-Manufacturers Index for the fourth quarter, which was reported at 20. The Tankan Large Non-Manufacturers Outlook for the first quarter was reported at -1. Economists predicted a figure of -1. Forex traders can compare this to the Tankan Large Non-Manufacturers Outlook for the fourth quarter, which was reported at 18. The Tankan Small Manufacturers Index for the first quarter was reported at -15. Economists predicted a figure of -20. Forex traders can compare this to the Tankan Small Manufacturers Index for the fourth quarter, which was reported at -9. The Tankan Small Manufacturers Outlook for the first quarter was reported at -29. Economists predicted a figure of -25. Forex traders can compare this to the Tankan Small Manufacturers Outlook for the fourth quarter, which was reported at -12. The Tankan Small Non-Manufacturers Index for the first quarter was reported at -1. Economists predicted a figure of -10. Forex traders can compare this to the Tankan Small Non-Manufacturers Index for the fourth quarter, which was reported at 7. The Tankan Small Non-Manufacturers Outlook for the first quarter was reported at -19. Economists predicted a figure of -15. Forex traders can compare this to the Tankan Small Non-Manufacturers Outlook for the fourth quarter, which was reported at 1. The Japanese Tankan Large All Industry Capex Index for the first quarter increased by 1.8% quarterly. Economists predicted an increase of 1.7% quarterly. Forex traders can compare this to the Japanese Tankan Large All Industry Capex Index for the fourth quarter, which increased by 6.8% quarterly.
Australian Building Approvals for February increased by 19.9% monthly. Economists predicted an increase of 3.0%. Forex traders can compare this to Australian Building Approvals for January, which decreased by 15.1% monthly. The Final Japanese Manufacturing PMI for March was reported at 44.8. Forex traders can compare this to the previous Japanese Manufacturing PMI March, which was reported at 44.8.
The Chinese Caixin Manufacturing PMI for March was reported at 50.1. Economists predicted a figure of 45.0. Forex traders can compare this to the Chinese Caixin Manufacturing PMI for February, which was reported at 40.3. The Australian RBA Commodity Index for March decreased by 10.2% annualized. Forex traders can compare this to the Australian RBA Commodity Index for February, which decreased by 6.0% annualized.
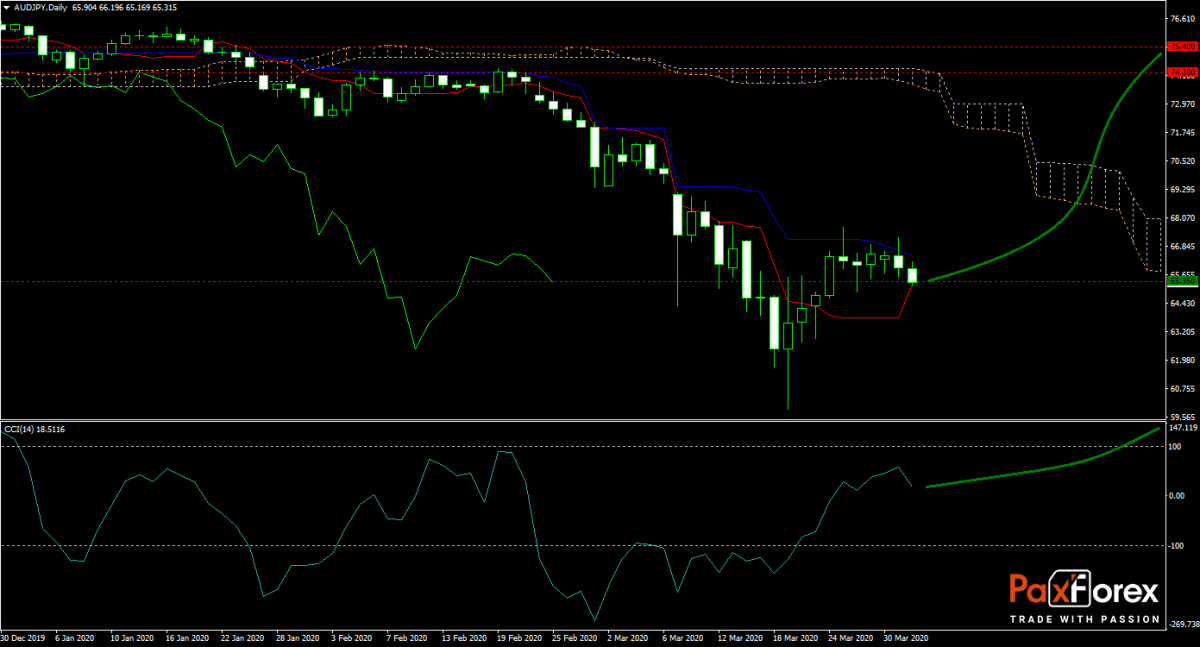
The AUD/JPY recovered from a plunge below 60.000. Bulls were able to push this currency pair back above support levels. The forecast for this currency pair has turned more bullish over the past few trading sessions, as Australia announced three economic stimulus packages worth $189 billion. Will the advance continue? Subscribe to the PaxForex Daily Fundamental Analysis and earn over 5,000 pips per month.

Should price action for the AUD/JPY remain inside the or breakout above the 64.900 to 66.400 zone the following trade set-up is recommended:
- Timeframe: D1
- Recommendation: Long Position
- Entry Level: Long Position @ 65.35
- Take Profit Zone: 74.300– 75.400
- Stop Loss Level: 63.800
Should price action for the AUD/JPY breakdown below 64.900 the following trade set-up is recommended:
- Timeframe: D1
- Recommendation: Short Position
- Entry Level: Short Position @ 63.800
- Take Profit Zone: 59.900 – 61.700
- Stop Loss Level: 64.900
Open your PaxForex Trading Account now and add this currency pair to your forex portfolio.


