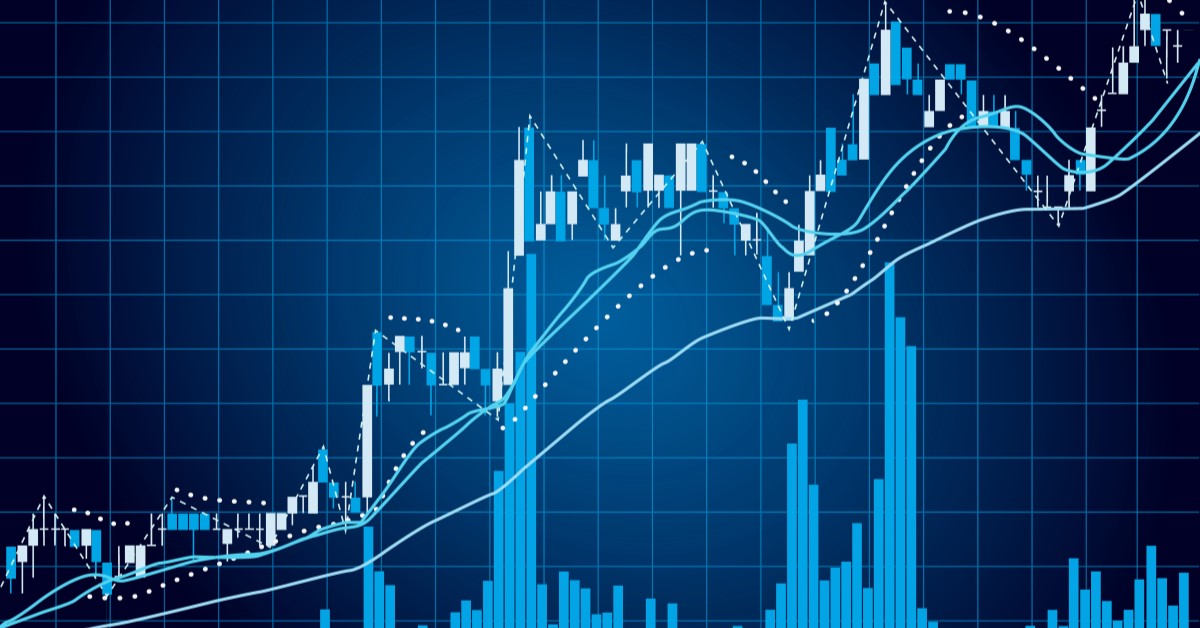

All price movement in Forex comes from bulls (buyers) and bears (sellers). When a currency pair moves up it is because there are more bulls than bears and vice versa. The Forex Market (and any market for that matter) is in a constant state of struggle between bulls and bears. Price action trading is about analyzing who currently controls price, bulls or bears and if they are likely to stay in control. If your analysis shows that bulls are in control and that they are likely to stay in control, then you can buy. If it shows that bears are in control and that they are likely to stay in control, then you can sell. How do you analyze who’s in control of price? By using two simple price action techniques: support and resistance areas.
Price action analysis was first introduced by Charles Dow, who laid the foundations for modern technical analysis. Since inception, it has been developed and advanced remarkably. Understanding price action gives you that extra edge you need to get over the profit line. That’s one reason more and more currency traders are interested in using a forex price action strategy as one of their main tools for crafting trading decisions. Since price action trading doesn´t predict the future like many other indicators, it never lies; it will tell you how the market will behave during different time frames and periods of volatility.
Price action can be read easily through the basic tools of technical analysis. Candlestick formations, retrace strength, wide range candles, engulfing patterns, dojis, pins, and narrow range candles are only a few examples of periodic price action barometers. Price action trading means that you read/analyze past or present price behavior in order to build a trading plan for the future. The strategies based on price action analysis can be divided into two groups: strategies where you have to observe the price fluctuation continuously in order to identify a market entry/exit point, strategies where you have to look at the past price movement on a chart and quantify a pending order. Each way is useful in building a valid forex price action strategy.
Many technical analysts use price action when calculating technical indicators or identifying chart patterns. The goal is to find order in the sometimes seemingly random movement of price. For example, an ascending triangle pattern may be used to predict a potential breakout since the price action indicates that bulls have attempted a breakout on several occasions and have gained momentum each time. Interpreting price action is very subjective. It is common for two traders to arrive at different conclusions when analyzing the same price action. One trader may see a bearish downtrend and another might believe that the price action shows a potential near-term turnaround. As a result, many traders would be better off using price action as just one part of a larger strategy.
Price action trading involves placing trades exclusively based on price action rather than fundamental or technical analysis. Swings (high and low), support and resistance levels, and breakouts and consolidation are some examples of price action. For instance, a short-term trader may watch for a price to breakout from a prior price that occurred on high volume before taking a long position. Price action trading is most common among retail and institutional traders. As a result, many traders would be better off using price action as just one part of a larger strategy.
To receive new articles instantly Subscribe to updates.