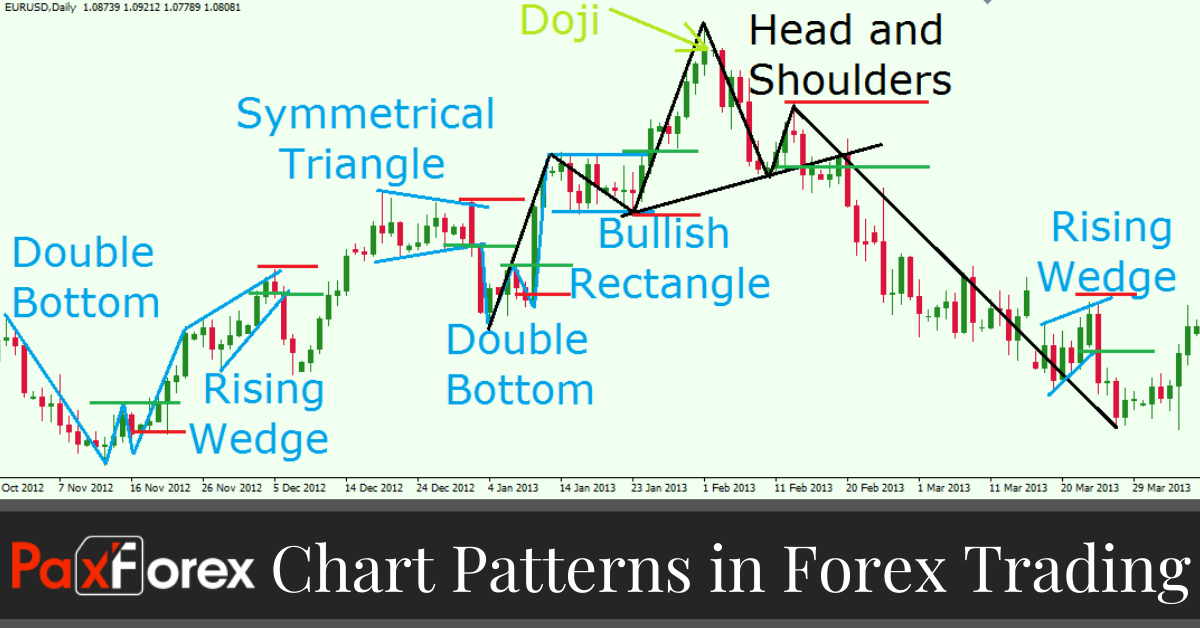
With so many ways to trade currencies, picking common methods can save time, money and effort. By fine-tuning common and simple methods a trader can develop a complete trading plan using patterns that regularly occur, and can be easily spotted with a bit of practice. Chart price patterns help traders recognize trends, movements and the patterns developed from the price fluctuations of currency pairs. Forex chart patterns can help you enter a trade on a low and exit high or as metaphorically known "ride the wave" of a pair's movements.
Chart patterns look at the big picture and help to identify trading signals – or signs of future price movements. One of the assumptions is that history repeats itself. The theory behind chart patterns is based on this assumption – that certain patterns consistently reappear and tend to produce the same outcomes. For example, as market sentiment shifts from optimism to fear, a certain pattern might emerge before traders and investors start selling and send the security's price lower.
You might also be interested
- Candlestick Patterns in Forex Trading
- Forex Chart Patterns
- Disadvantages of Technical Analysis in Forex
- What are Fractals in Forex Trading
- Forex Daily Chart’s for Successful Trading!
Patterns are born out of price fluctuations, and they each represent chart figures with their own meanings. Each chart pattern indicator has a specific trading potential. In fact, chart patterns represent price hesitation. When you have a trend on the chart, it is very likely to be paused for a while before the price action undertakes a new move. In most of the cases, this pause is conducted by a chart pattern, where the price action is either moving sideways or not very persuasive with its move.
Mastering the art of trading with chart patterns allows traders to anticipate movements in the market well in advance. No matter what currency pair you are observing, every pattern says something profound about the mood of the market. In a wider sense, every group of candlesticks gives us an insight into the bigger picture. When read in the right way, chart patterns can be the key to unlocking where the market may be headed. With the right skills, these patterns can be identified, interpreted, and exploited.
The two most popular chart patterns are reversals and continuations. A reversal pattern signals that a prior trend will reverse upon completion of the pattern, while a continuation pattern signals that the trend will continue once the pattern is complete. Chart patterns are a valuable part of the technical analysis – even if they are more art than science. Many traders use them to identify potential trades that they can confirm using other forms of technical analysis to maximize their odds of success


