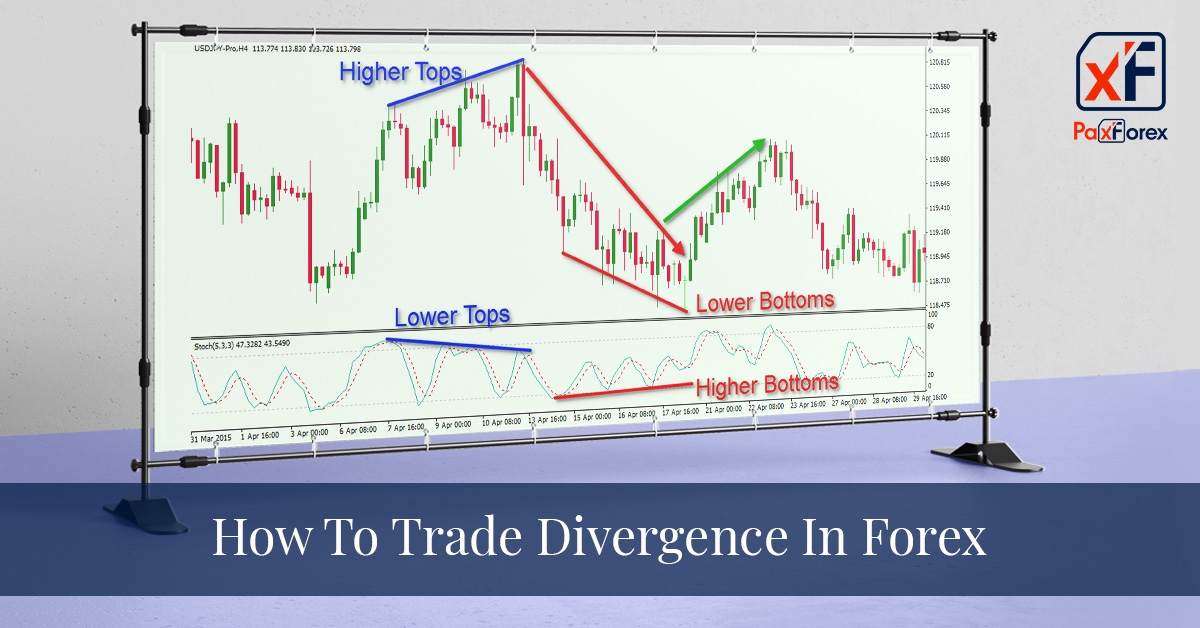
Trading divergence is one of the ways to trade on the Forex market. Although this strategy is not often applied, if used correctly it can be very profitable. Divergences are often used as important trading signals. But this does not mean that they will always predict the trend reversal correctly. The divergence of price oscillators has long been recognized by technical traders as a clear indicator of potential price reversals. Clearly visible divergence, especially on long-term charts, can be extremely accurate in many cases.
Convergence is the coincidence of the price chart and technical indicator. To make it simpler, it is when there is a downward trend in the price chart and the technical indicator, the heights also lower, i.e. a single direction. Graphically, it looks like this:
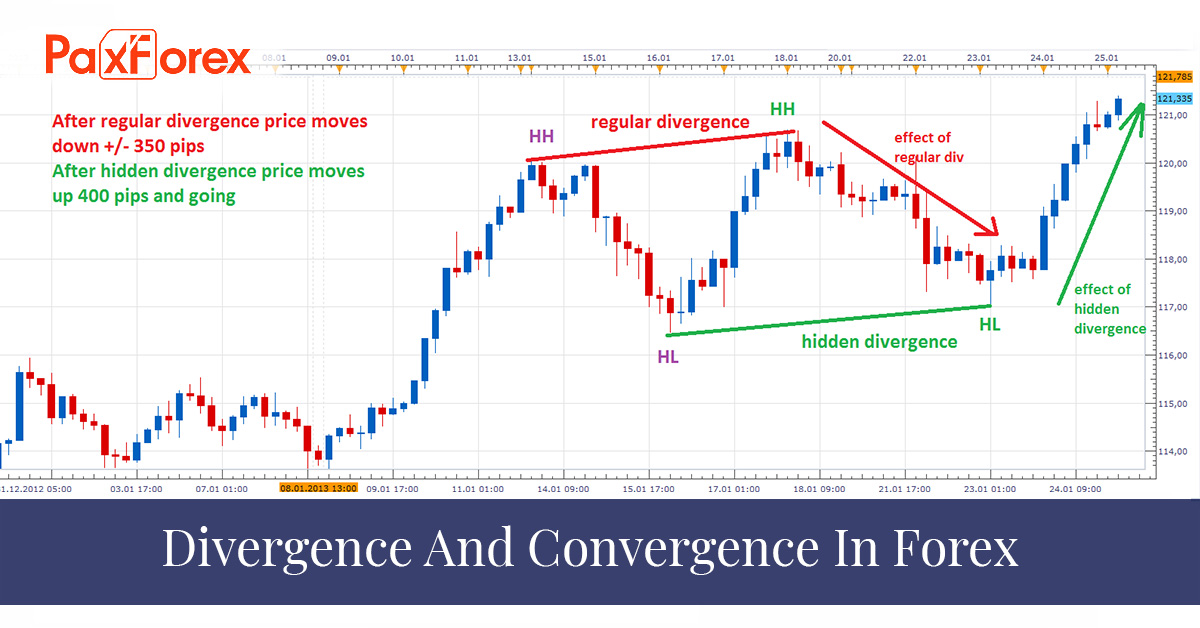
As can be seen in the figure above, the Awesome Oscillator (AO) is used to spot the convergence in this case. One can easily use the MACD oscillator, which is developed to determine this property, but it has a completely unsightly appearance in the trading platform because it is used for completely different purposes. So, the blue lines on the chart reflect the slopes of the current trends. And if you look at the slope of the price and indicator lines on the chart at the same time, you will see that they are moving in the same direction. Otherwise speaking, the readings converge.
Divergence is a difference between the price chart and technical indicator. In other words, it happens when there is an upward trend in the price chart and a descending trend in the technical indicator. That is, there is a different direction (slope). Graphically, it looks as follows:
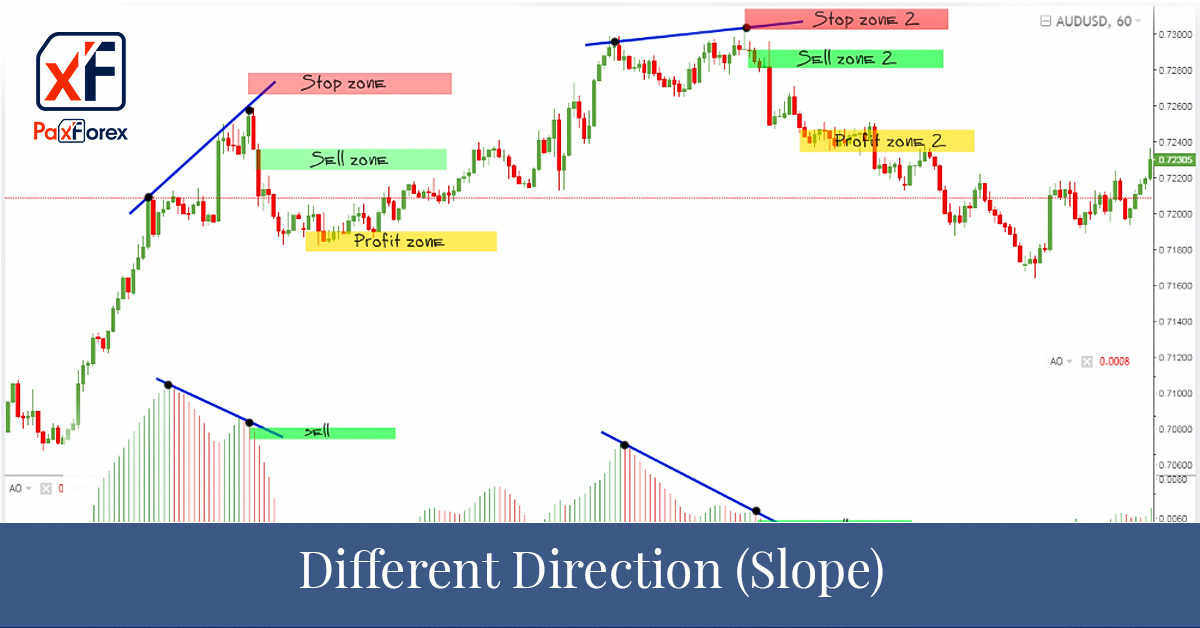
Again, we use the oscillator AO for spotting it. The divergence in the above figure is shown likewise to convergence. Just now we can see that the incline of blue lines on the price chart and the indicator has the contrary course. In other words, the readings differ, which is the principal definition of the divergence. There are a lot of practical properties of divergence. The foremost thing is, obviously, the fact that the divergence appears on the price chart exclusively at the times when the current trend weakens and goes into the shift stage. Put another way, divergence is one of the principal signs of a trend reversal.
It is advisable to pay attention to 2 nuances - they will increase the efficiency of the trading.
Firstly, it is a fundamental analysis. Before opening any trade on a divergence, look through the news for the near future - isn't there something important that can unpredictably affect the market? If there is such news, no one will be interested in technical analysis, and despite the divergence, quotes will easily go against it!
Secondly, calculate the volume of the trade in order not to lose more than 2% of the deposit. No matter how strong and correct the signal may seem, the capital should be protected. There will be a lot of positions, and no one will give you the capital for nothing.
Trading divergence is simple and effective enough, suitable for both experienced and novice traders. Divergence is a strong signal to open a position against the current trend.
To use this trading approach one can use any Forex asset with direct quotes: GBP/USD, USD/CHF, USD/JPY, AUD/USD, etc.
The state of divergence is spotted by MACD or RSI indicators. Recommended parameters of the indicators:
- MACD (12,26,9) or (5,34,5).
- RSI (indicator period14, averaging period 5)
- The working time frame is 1H.
The specified parameters for the indicators have been obtained experimentally and are the most effective. However, each trader can choose them independently if he wants to get a clearer picture of divergence.
Then wait for the divergence to form on the trading interval chart. We determine the levels of a stop order and profit setting. Let us consider two options:
Formation of divergence when the resistance level is broken down
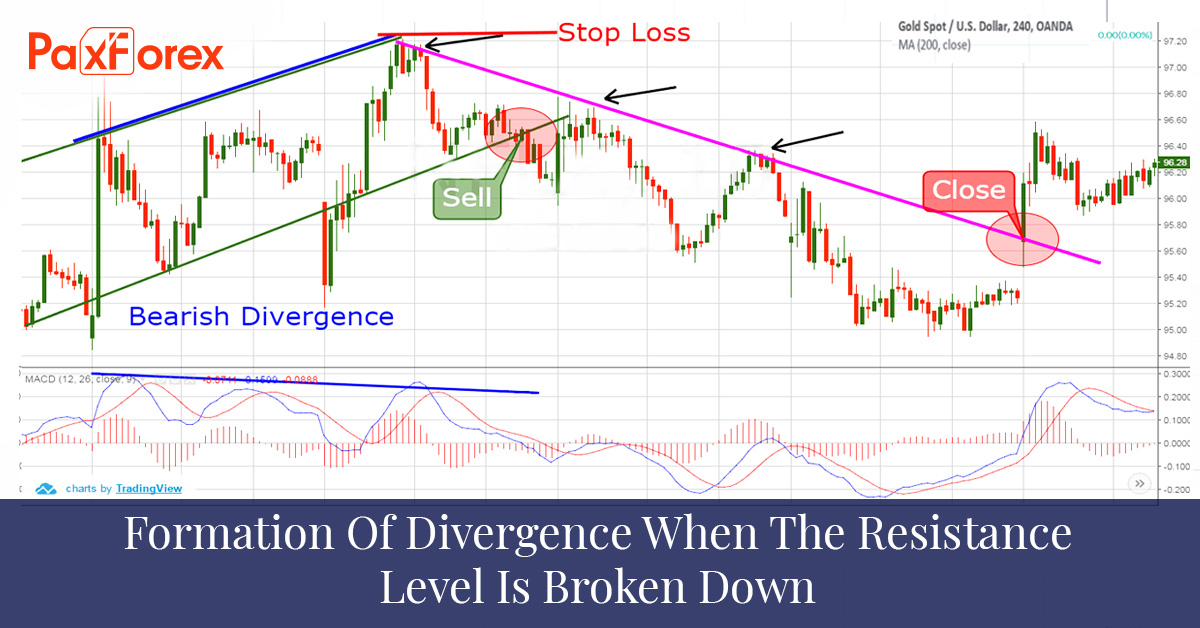
In this case, the stop order is set tentatively, depending on the volatility of the traded currency pair by 15-30 points for the level of the shadow of the previous candle. We set the profit at the level where the divergence began. In practice, this is a guaranteed target for the price. We should not hold a position against the trend any further.
Formation of divergence when the price bounces off the border of the trading channel
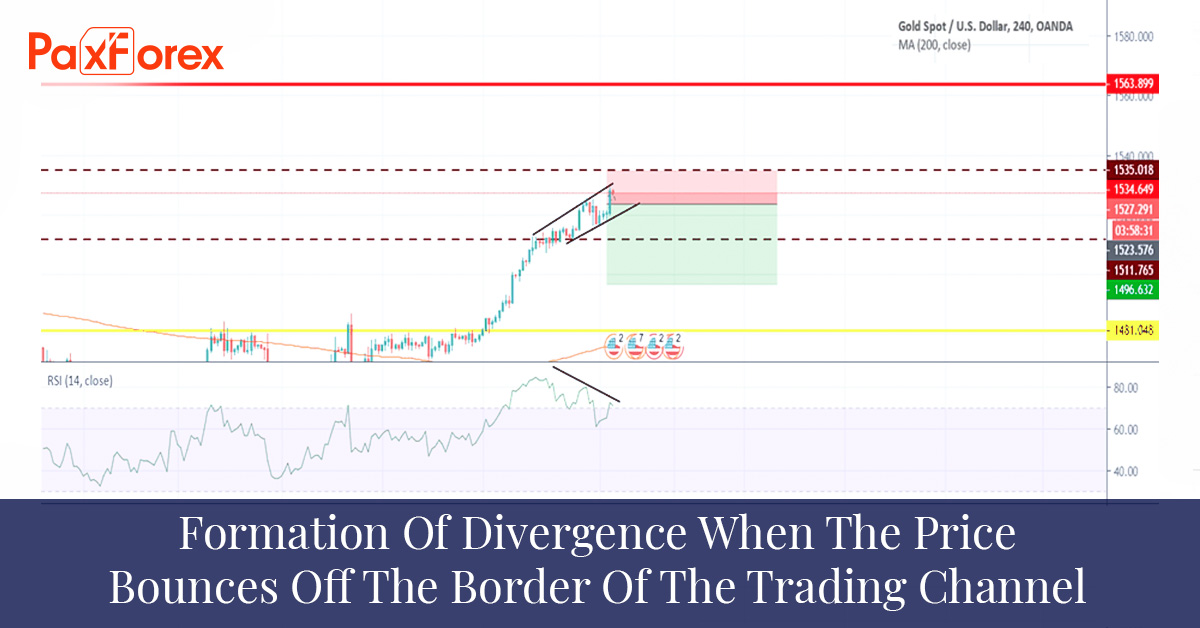
We expect the price and divergence indicator to appear on the chart. In this case, the protective order, depending on the volatility of the traded currency pair, is placed, as in the previous case, by 15-30 points for the level of the shadow of the previous candle. And the aim for gain is the middle of the trading channel. If the price does not bounce off the middle of the channel, we set an additional target, the second target is the opposite wall of the trading channel.
A buy/sell order is placed after a confirmation candle is formed.
Also keep in mind that good, clear market divergence is not a frequent phenomenon. There are many situations when a trader waits for additional confirmation to open a position. As a rule, in such cases, the trader misses the opportunity to enter the market at the best prices, because the divergence is usually worked out within 30 minutes on the hour chart. Therefore, if there is a good divergence on time, it is necessary to act decisively.
Conclusion
The method of trading divergence can be surprisingly effective for defining the moment of the main events in the Forex market when used in conjunction with other trading indicators. Divergences are often used as signals of possible turns and reversals. However, divergences are not often used as a completely self-sufficient trading strategy.
We are one of the fastest growing Forex Brokers in the Market. Trade with PaxForex to get the full Forex Trading experience which is based on...
- The Reliability on all Assets in the Market
- Trusted Worldwide for over a Decade
- Live Multi-Lingual Online Support 24/5


