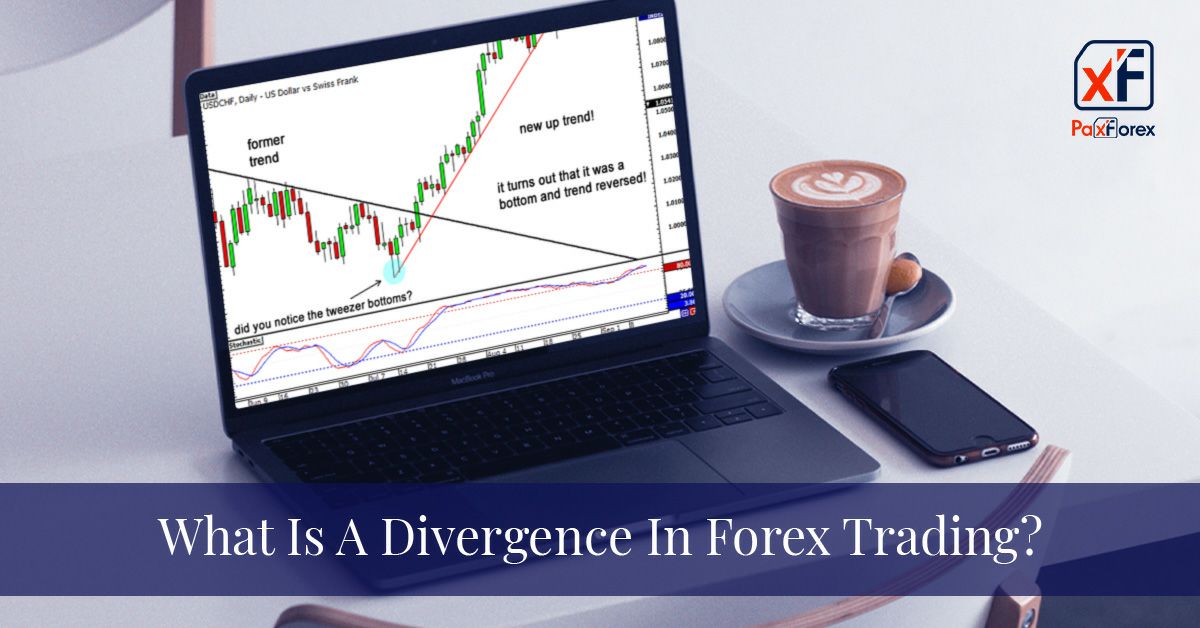
Doing technical analysis, absolutely any trader is interested to see in advance where the rate of this or that asset will move. After all, in order to trade profitably, it is important to see the divergence of Forex on any timeframe.
That is why it is a rather popular type of trading on the Forex market among professional traders. It is regarded as a specialty of professionals, and beginners are not recommended to get involved in this topic. However, we will try to what it is in the most accessible language, understandable even to beginners.
Divergence in the Forex market is one of the key indicators in the technical analysis of currency trends, which shows the discrepancy between the direction of the price chart and the selected technical indicator.
The presence of divergence on the chart shows a possible rate reversal. It is usually called bullish or bearish, depending on where the price will go after the reversal: bullish divergence indicates growth, bearish divergence indicates decline.
Types of divergence
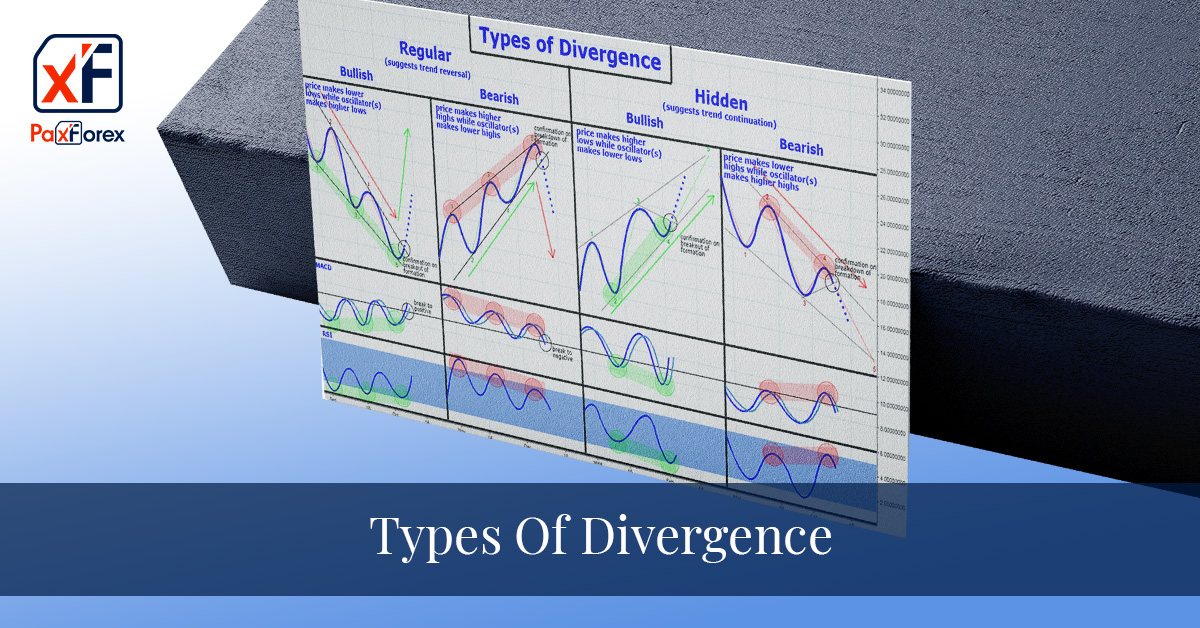
In Forex trading it is common to distinguish between several types of divergences:
Class "A" divergence
Class A is considered the most important, capable of providing the best quality signals. As a rule, it is an indicator of a strongly pronounced price trend reversal.
- Class A: bearish divergence - the new high in the price chart is above the previous one, while the new high in the oscillator chart is below the previous one.
- Class A: a bullish divergence - a new low in the chart is below the previous one, while a new low in the oscillator chart is above the previous one.
Class "B" Divergence
This one is a less significant signal that needs additional analysis (another indicator).
Divergence of class "C"
The C class divergence is more a result of delays in the dynamic market than a signal. This signal is so weak and ambiguous that it is often ignored by traders.
There is also a special type of divergence - triple divergence. It is the rarest and almost unmistakable forex signal. It consists of three fluctuations (either highs or lows, both in the price chart and the oscillator). An interesting feature is that the initial divergence signal fails.
As a rule, most often the divergence is spotted visually on the chart. For the convenience of traders, several technical indicators for divergences have been specially designed, which greatly simplifies the spotting of divergences and trading on them.
For this purpose, you can use absolutely any indicator that works on the principle of an oscillator, but the most popular are considered MACD, Stochastic and others.
One can search for divergences manually, or just use the appropriate tools. This method is especially convenient for beginners who have not yet studied the intricacies of divergence spotting. For this purpose, it is better to use divergence indicators, which currently number more than a dozen. Let's look at the most popular ones among traders.
MACD Divergence Indicator
This one of the oldest and proven indicators, which is a part of many trading systems in the Forex market. Its demand is due to the appearance of the MACD divergence indicator. The program itself looks for discrepancies in its readings with the current price, draws lines and marks the entry points with arrows. Indicator installation in the MT4 trading terminal is standard. After moving the instrument to the working chart, it will look like this:
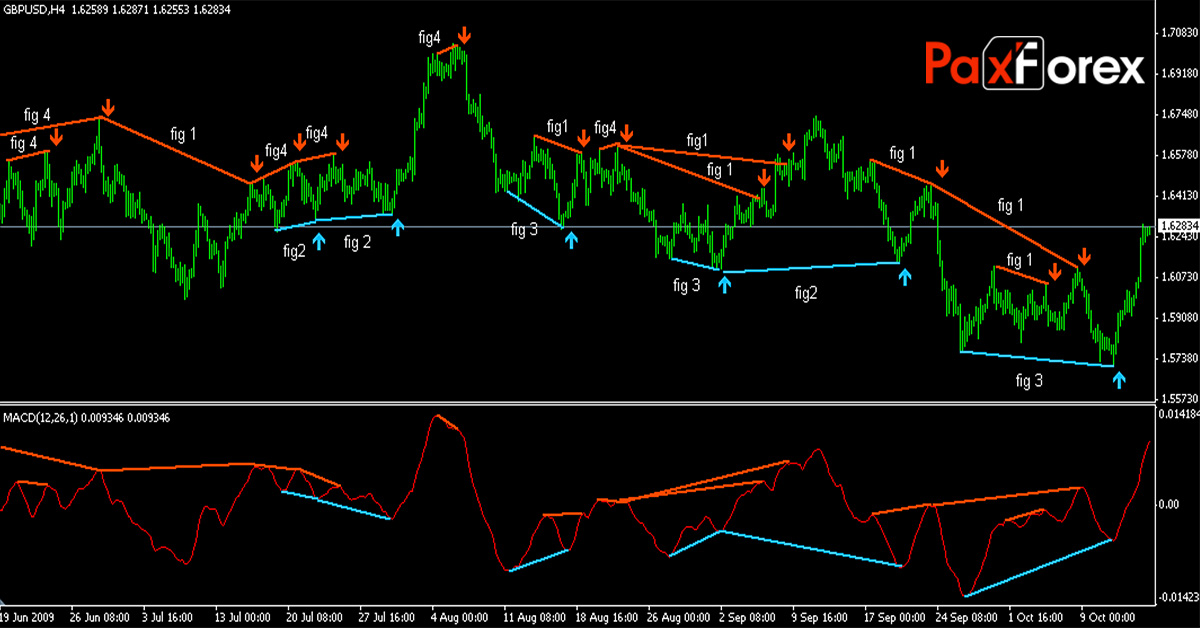
The red arrows and lines indicate that the signal appears downwards. Accordingly, the arrows and lines of blue color are formed when there is a divergence that suggests buying a currency pair. The indicator local extrema are marked with blue, red and white dots.
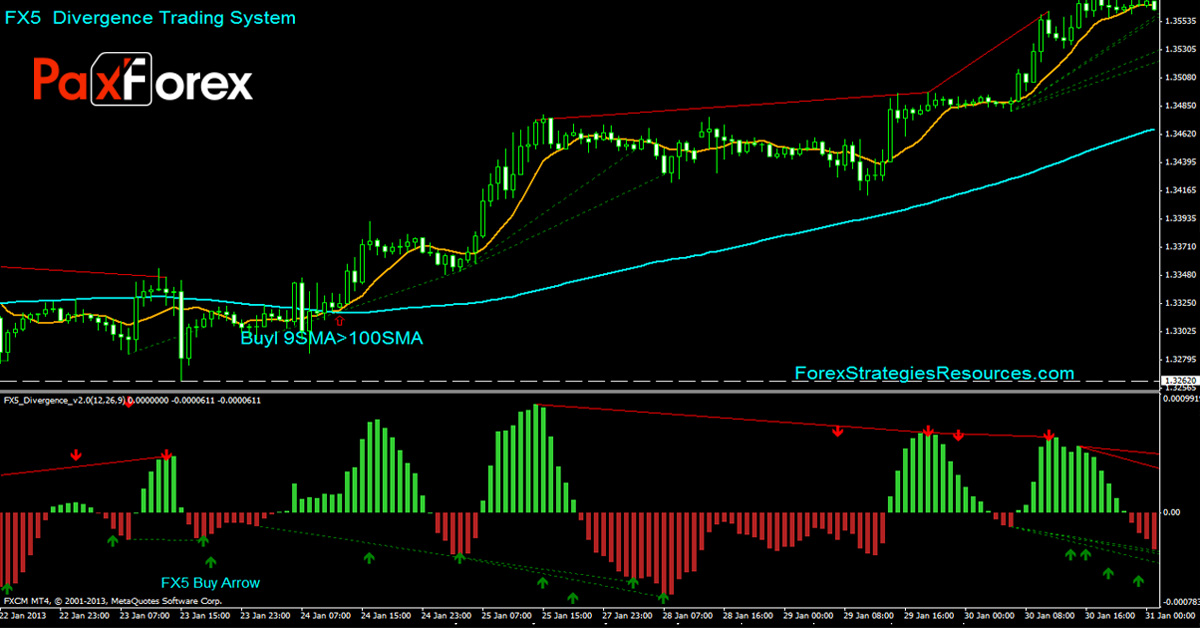
The indicator of divergence the Fx5 Divergence
The following tool, which can detect divergence in automatic mode, works based on the popular OsMA indicator. Its distinctive feature is that it produces a lot of signals on any timeframe. Unfortunately, most of them are false. However, the indicator is not an Expert Advisor and does not give clear signals. Its main task is to show on the chart all the differences between the price and local extrema of the oscillator. A trader should "separate the wheat from the chaff" and choose promising signals, ignoring doubtful ones.
As for the indicator settings, they should not be changed. The program works well with preset parameters, half of which refer to the period of the OsMA indicator, and the other half is responsible for sensitivity.
Spotting the divergence by Stochastic
The next indicator is based on the previous one. It has the same principle of spotting divergences, but it is based on the standard indicator from the MetaTrader 4 terminal - Stochastic. The instrument is considered to be the most accurate, but it has the same drawbacks as the previous two ones. In order to test it personally, one should just download the archive and install it to the chart of any currency pair. The preferred timeframe is M15.
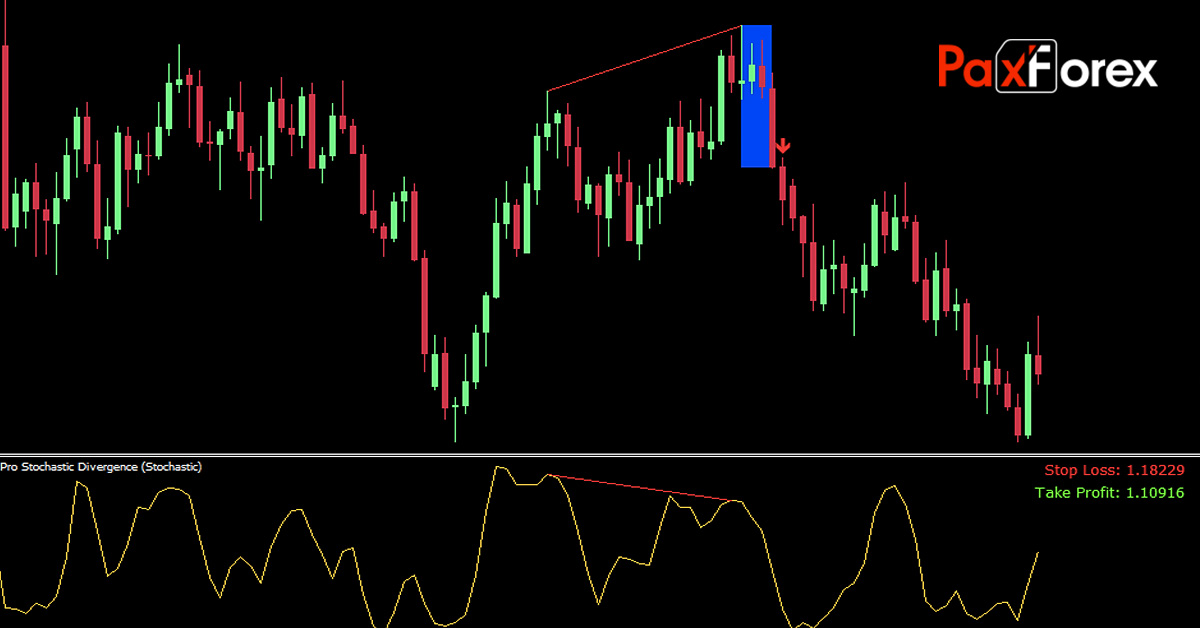
Of course, divergence indicators are not the panacea, capable of providing traders with quality signals in a semi-automatic mode. They are only an assistant for traders who have not yet learned to visually detect the divergence between price and oscillator. Nevertheless, knowledge about the main types of divergences, the principles of their search and the strength of the signal is necessary for everyone who has just started or has long been trading in the Forex market.
Conclusion
Divergence in the Forex market is a constant phenomenon and is one of the most powerful elements of technical analysis. However, it is not simple to see divergence on a chart. Experience can help you with that.
Naturally, you should not rely on divergence alone when opening a position. You should take into account the indications of other indicators, support/resistance levels graphical patterns, and Price Action signals.
We are one of the fastest growing Forex Brokers in the Market. Trade with PaxForex to get the full Forex Trading experience which is based on...
- The Reliability on all Assets in the Market
- Trusted Worldwide for over a Decade
- Live Multi-Lingual Online Support 24/5


