

Last week I discussed the importance of candlestick patterns in my Bitcoin - Forex Combo Strategy. For those who missed the post, please make sure to read it at “Bitcoin - Forex Combo Strategy: Candlestick Patterns”. It is very important for you that you not only learn about them, but also understand what they tell you about price action. Mastering candlestick patterns in conjunction with other aspects can really make a big difference when it comes to profits and losses. Since trading successfully is all about a continued series of profitable trades and managed losses, I highly recommend that you don’t skip last week’s lesson.
Today I will familiarize you with another key aspect of my trading approach. While candlestick patterns offer great insight into price action, by themselves they won’t yield the greatest results. They need to be used with other aspects of technical analysis in order to give accurate trading signals. I use them in conjunction with Fibonacci Retracement Levels which indicate key support and resistance levels. Unlike moving averages, Fibonacci Retracement Levels are static prices and represented by horizontal lines which makes it very easy to see next support and resistance levels.
A typical Fibonacci Retracement Sequence consists of 0, 23.6, 38.2, 50.0, 61.8 and 100.0. Please not that 50 is not a true Fibonacci Retracement Level, but has been added for support and resistance levels. 0 and 100 represent the intra-day low and high of the period covered, the Fibonacci Retracement Levels are drawn by connecting the high and the low through a trendline and then dividing it by the remaining four ratios in order to get the support and resistance levels. Don’t worry, you don’t have to calculate this by yourself. There is a ready made “Fibonacci Retracement Indicator” which you can use in your PaxForex MT4 Trading Platform. Simply click on the button which I have highlighted in the image below.
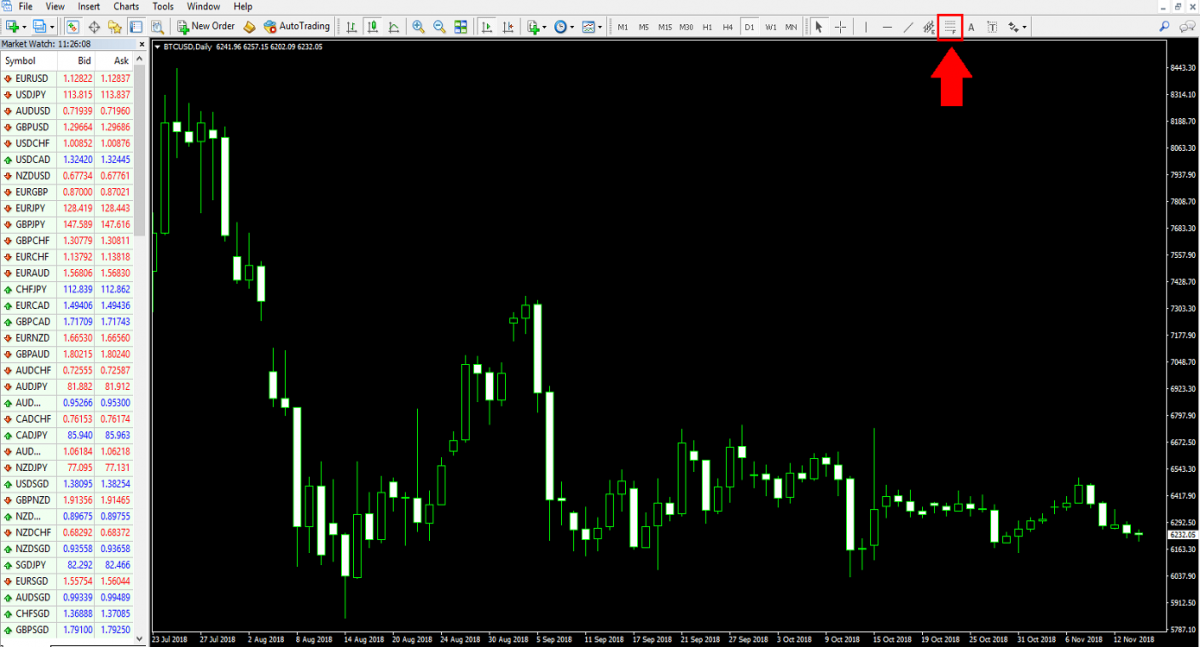
After that just click your left mouse button and draw a trendline from the intra-day high to the intra-day low. You can click just above the intra-day high and just below the intra-day low as the indicator will automatically adjust. You can customize the colors as you please, simply double-click the trendline in order to select the indicator. Then right-click and from the menu select “Fibo Properties…” and you can make changes. The image below shows the default settings and also the menu box you will if you want to start customizing it. Feel free to change the colors and style, but I do not recommend adding your own retracement levels.
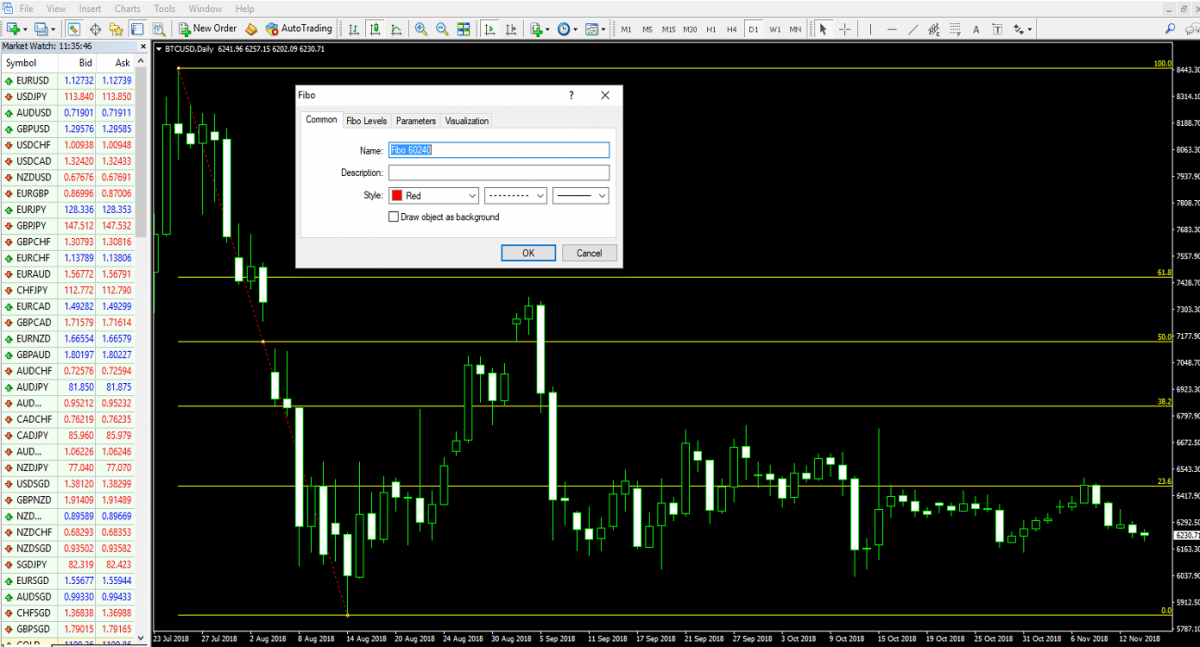
The most important Fibonacci Retracement Level to keep in mind is 61.8 as it is the inverse of the Golden Ratio which is 1.618, also referred to as Phi. In the majority of cases, the 61.8 level is the maximum retracement level before price action will resume its previous trend. Therefore, a lot of trading action is expected at this level which is often followed by a reversal. Please keep in mind that none of the levels are guarantees for anything to happen and once again should not be viewed isolated. A combination of factors pointing in the same direction creates solid trading signals.
When you combine candlestick patterns with Fibonacci Retracement Levels you can spot price action reversals or the end of an existing trend. Other factors such as volume and momentum, which I will cover in follow-on posts, are also crucial in order to confirm a trading signal. I usually look for a confirmation of all four before committing to a trade, but at times I will take a position after three are present. As you start using my strategy you will develop your own feel for the trade and make adjustments on a trade-by-trade basis. It does take a lot of trading to fine-tune my strategy, but it is time well invested!
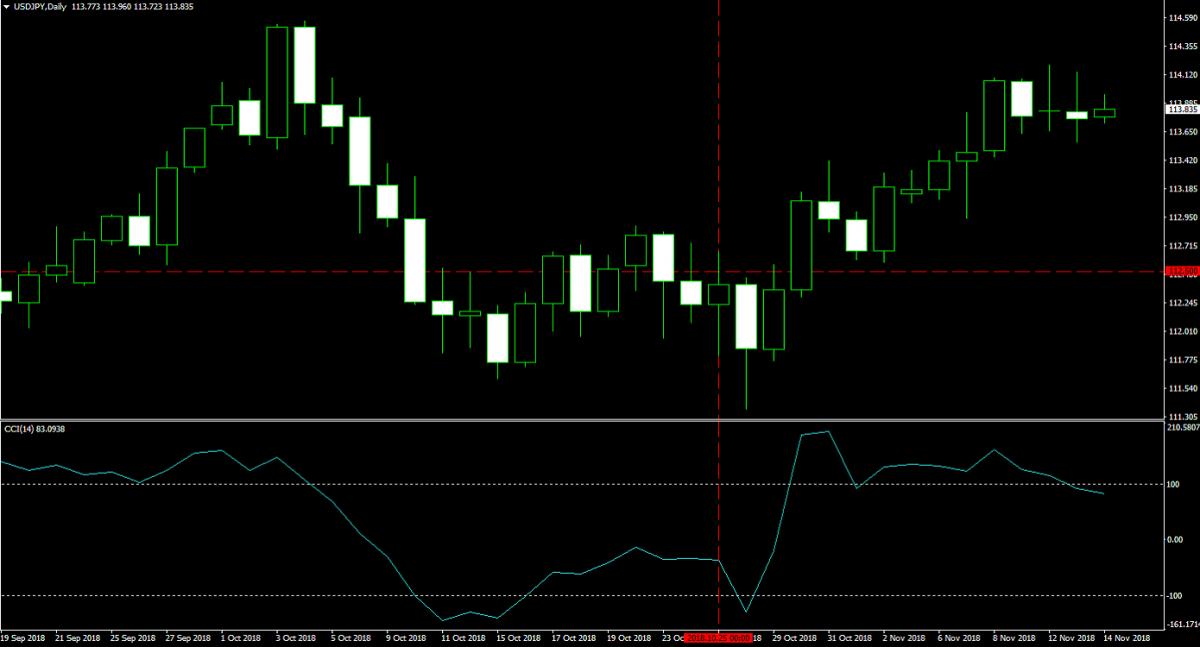
Let’s get to my updates since my last post. I keep my 40 lots short position in the USDJPY at 112.500. The margin requirement was $8,000 and each pip is worth $355.43. This trade extended its advance, but I see signs of a breakdown in the up-trend. The CCI has moved below 100 and I expect the contraction to continue which favors a price action reversal. This position currently carries a floating loss of just above $47,000. The image below shows the day I took the trade and my entry level. You can also see the breakdown in the CCI.
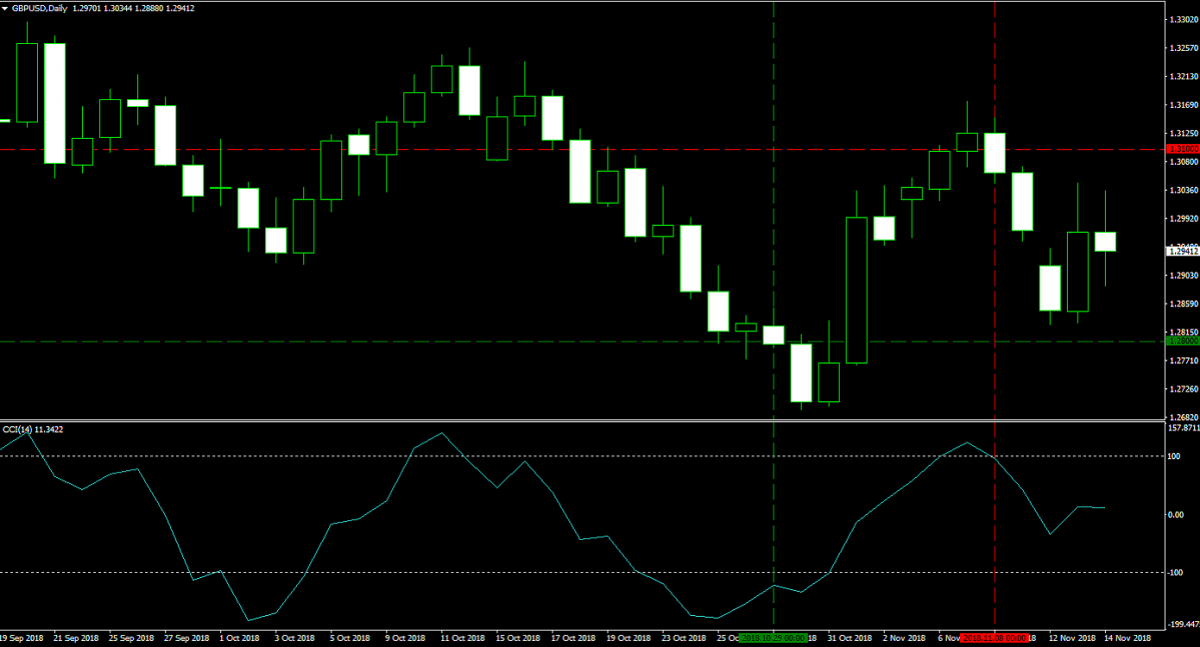
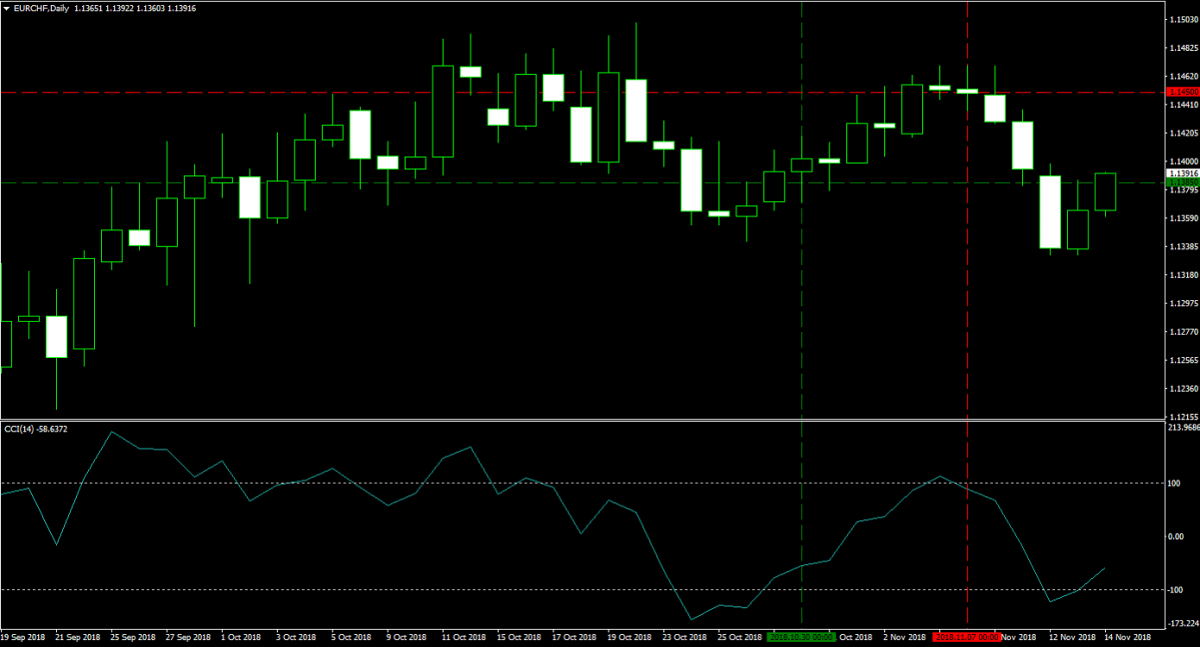
My stop loss was triggered in my GBPUSD long position at 1.3100 on November 8th 2018 and I exited this trade for a profit of 300 pips or $120,000. It is very important to protect your profits as your trade develops. Professional traders use a stop loss order to accomplish this. As your trade moves into the right direction, adjust your stop loss level at your own discretion. This ensures that you will exit a trade with guaranteed profits regardless of what price action does. Another example of this is my EURCHF position which was closed on November 7th 2018 as the stop loss was triggered for a profit of 50 pips or $20,000. The images below shows both complete trades.
My two long-term trades, Ethereum and Gold, took a nose dive over the past few sessions. My 1,000 Ether are currently worth about $196,000 and held in my Ethereum wallet and separate from my forex account. My 100 lots of Gold, which I moved into a sub-account at PaxForex together with $250,000 in cash, are currently worth $180,679. The margin requirement of $123,179 plus an investment gain of 57,500. The combined value of my long-term holdings is $376,679 plus $250,000 in cash for a total of $626,679. In my main trading account I have $315,899 in cash.
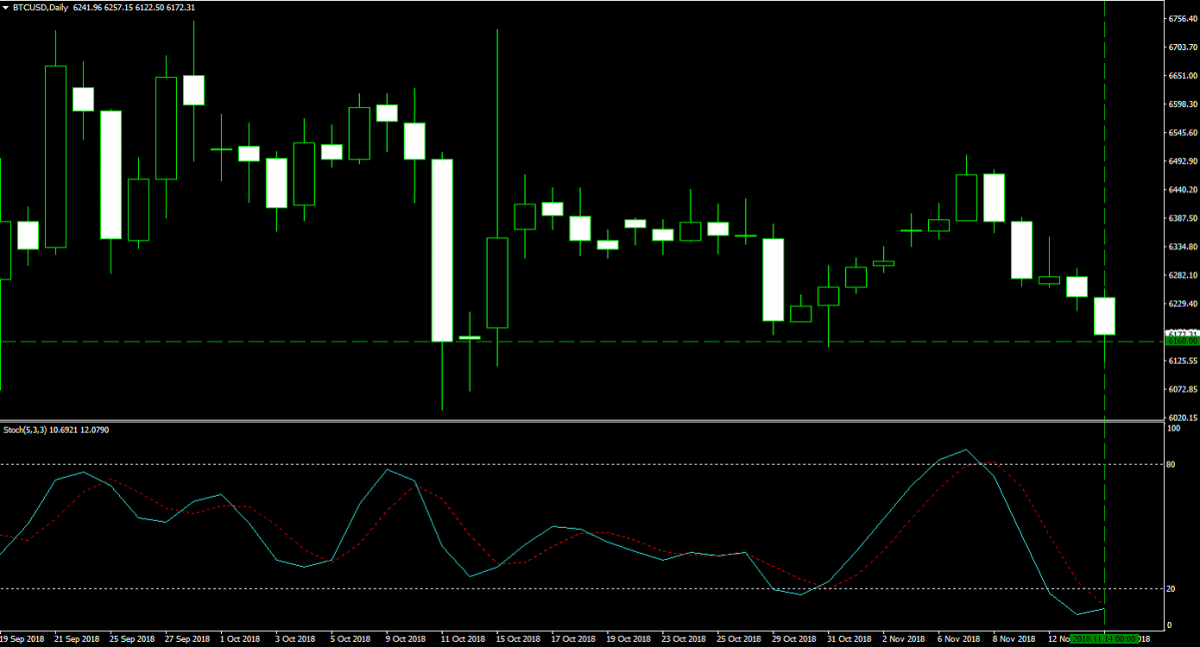
I bought 50 Bitcoin today at $6,160 for a total consideration of $308,000. This trade left me with $7,899 in cash in my primary forex trading account as I keep my cryptocurrencies in separate wallets. I am looking for a small gain in Bitcoin, but the current price and technical set-up were too good to pass on. It is always important to keep an open mind when analyzing markets. There are times when I take on more forex trades and others when I trade more cryptocurrencies. The image below show today;s entry into Bitcoin.
My total assets currently consist of $626,679 in long-term assets, divided into $196,000 in Ethereum, $376,679 in Gold and $250,000 in cash. I have one open Bitcoin position worth roughly $308,000 and one open USDJPY short-position worth -$39,000 (my floating trading loss of $47,000 plus the margin requirement of $8,000) as well as $7,899 in cash. My total assets are therefore worth $903,578. This is down $492,321 as compared to last week and was primarily due to the plunge in Gold. I do think prices will recover and soon push me back above the $1,000,000 level.
To receive new articles instantly Subscribe to updates.