One of the most important parts of my Bitcoin - Forex Combo Strategy are candlestick patterns. Different traders prefer different chart types, but to me candlestick charts present me with the most important information I need when looking at price action. It always depends on what you are looking for, some prefer to use a very simple lime chart as others get their trading signals from a bar chart. Some hardcore price action traders only use point and figure charts. There is no right or wrong choice as long as you make money from your choice.
From my experience when it comes to trading Bitcoin, candlestick patterns have always played a key role. They are great at pointing out trend reversals or to confirm support/resistance levels. Knowing the different types of candlestick patterns, understanding what they mean and using them to time my entry as well as exit levels has been a very big contributor to my success with the Bitcoin - Forex Combo Strategy. It enabled me to grow my account balance, remain in profitable trades longer and spot reversal which resulted in me taking bigger actual profits rather than watch volatility eat away my floating profits.
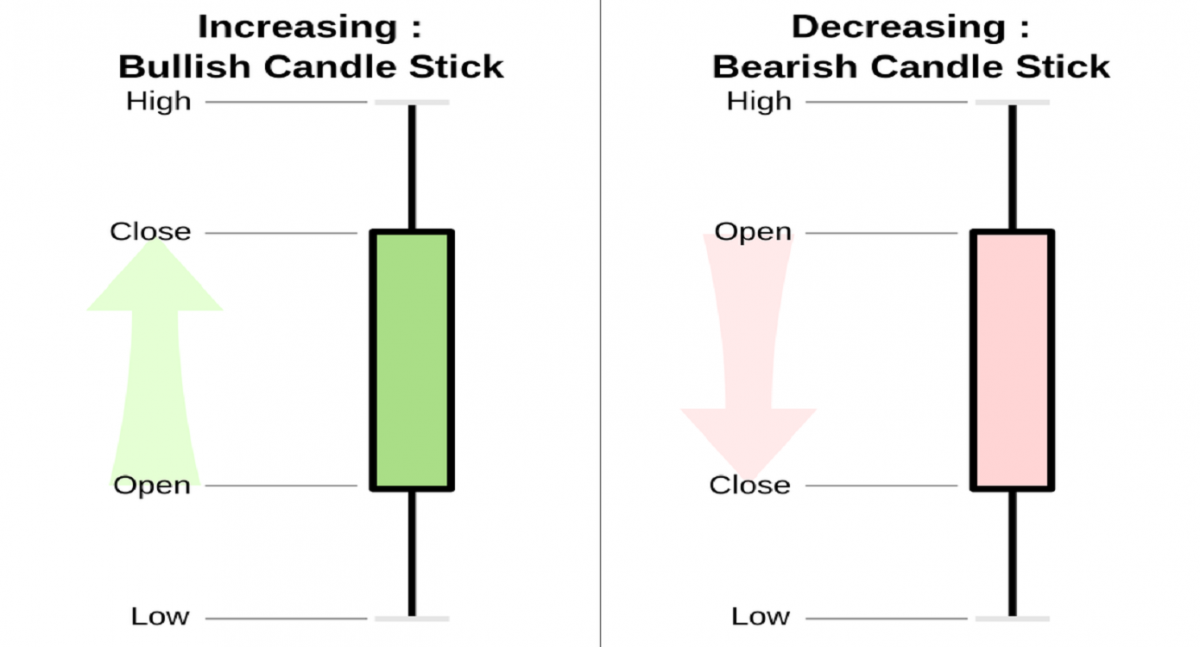
Let me explain to you the data which you can get from a candlestick. Candlestick charts have been first used by Japanese rice traders over 300 years ago and they are great to show how bulls and bears have battled each other for any given time-frame. You can quickly see where the price opened the trading sessions, the highs and the lows as well as the close for the session. In addition the formation and location of various patterns can show you if a bullish or a bearish reversal pattern is around the corner. It also gives confirmation if an existing trend is likely to extend so you can stay in the trade an increase your profits. Below is an example of what a candlestick looks like.
As I was making my trading decision with Bitcoin, candlestick patterns have help me to successfully identify reversals. Without this knowledge about a pending price action reversal, it would have been almost impossible for me to turn my initial $12,500 into over $1,000,000 in just over a year. You can read about my start with the Bitcoin - Forex Combo Strategy at “Bitcoin - Forex Combo Strategy Part 1”. In a five series post I have described how I have traded in-and-out of Bitcoin and how I have added Forex trading into the mix which helped me boost my profits further.
I tried to walk you through my trades in those five posts, but I also want you to learn how you can duplicate my success without my help. It is always important to me to teach those interested in using the tools which I have used in order to recreate my success. Even better when those traders learn to use my approach and identify their own profitable trades and trading opportunities. Please feel free to use anything you read and learn about and apply your own metrics and theories to it. Never be afraid to try something different as this is the only way we learn.
You might also be interested
- Advantages of Forex Candlestick Charts Trading
- Forex Candlestick Charts
- Forex Trading Charts
- Ezequiel’s Tech Savvy FX Strategy
- What is one hour Forex strategy
- What is Backtesting in Forex Trading
- Forex Exit Strategies
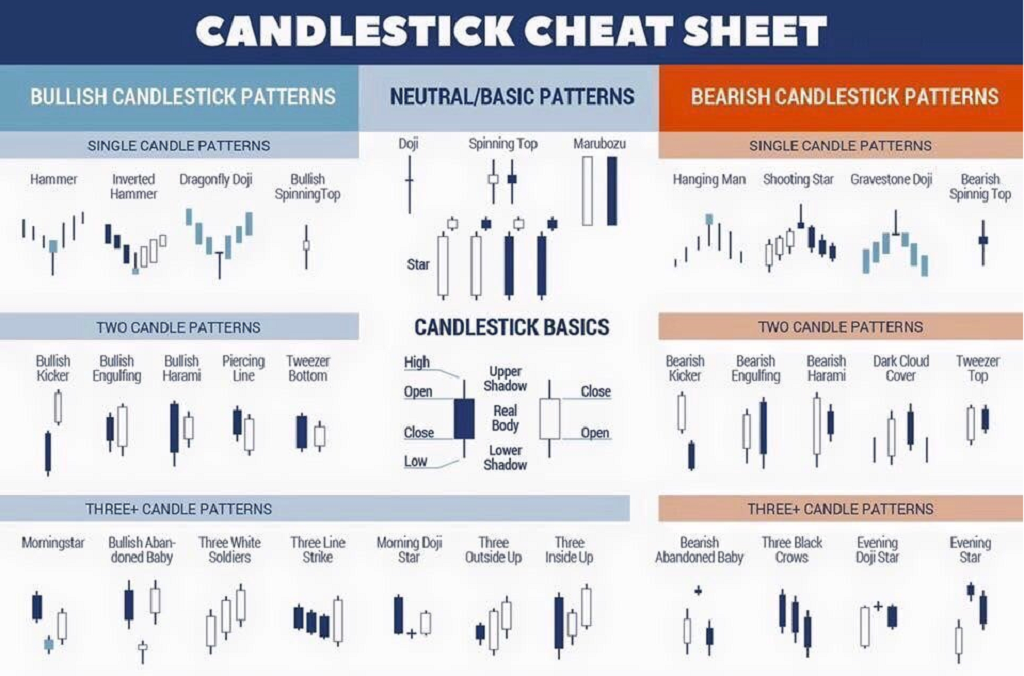
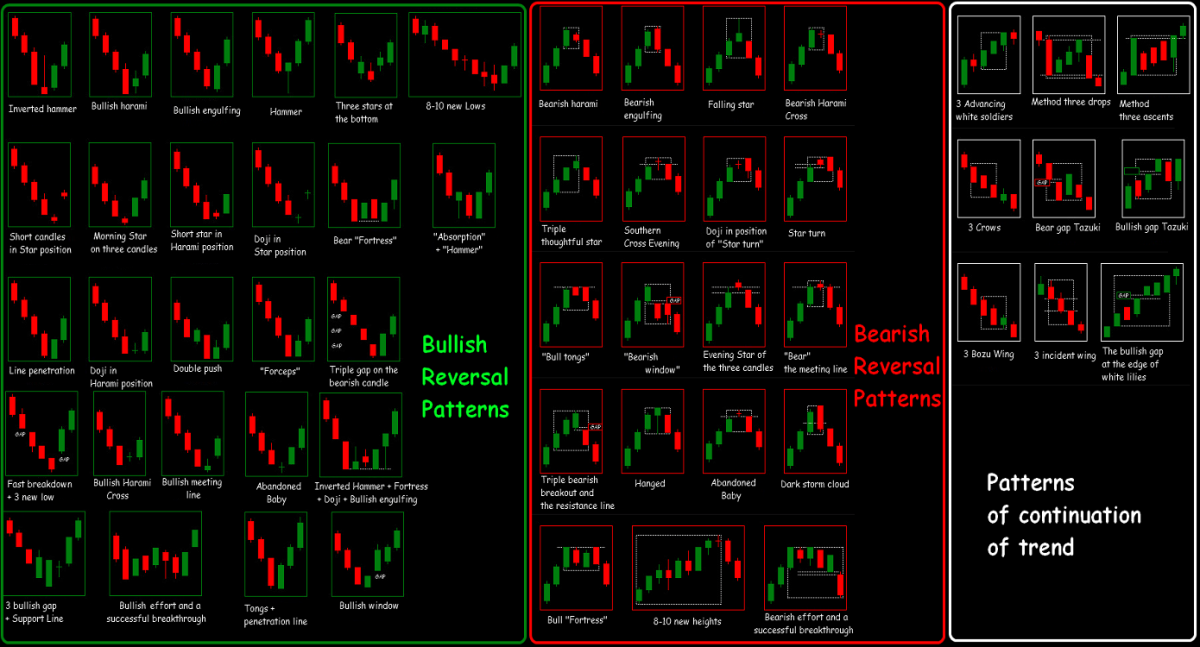
The next thing I recommend to all my followers and readers is to learn about the different candlestick formation and what they mean. I added an image below which will get you started. Make sure you take your time with this, learn all of them and repeat until you can identify them in charts. Make sure that you always wait for a candlestick to close as it could change its pattern prior to it. The time-frame which you want to use really depends on you, but I use the D1 time-frame as it has worked great for me over the past year. Shorter time frames will create different trading signals than longer ones and as a rule of thumb, the longer the time-frame is the more accurate the trading signal will be. Below its the chart which I have mentioned earlier with the candlestick patterns.
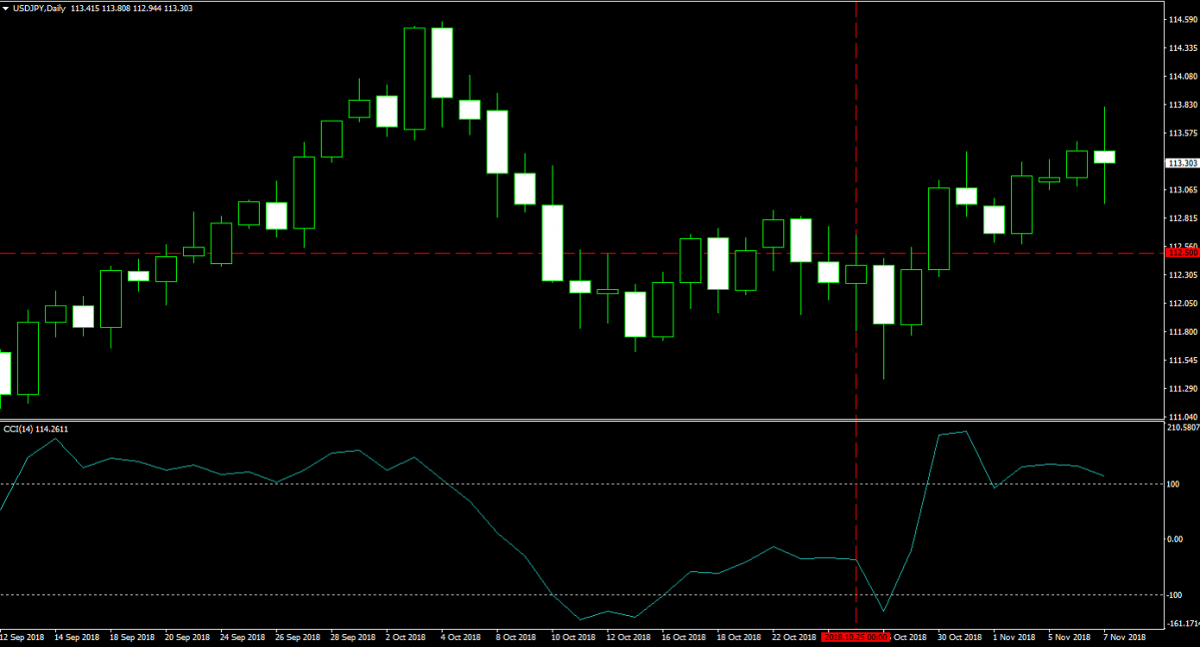
Now let me update you on my three open forex trades from last week. My short position in the USDJPY remains open. I shorted 40 lots at 112.500. My margin requirement was $8,000 with a pip value of $355.43. As I write this post, this short position carries a floating loss of roughly $28,500.The image below shows my open trade and I want you to take a look at the current candlestick pattern. It may form a spinning top at resistance which would signal a potential bearish price action reversal and turn my trade profitable.
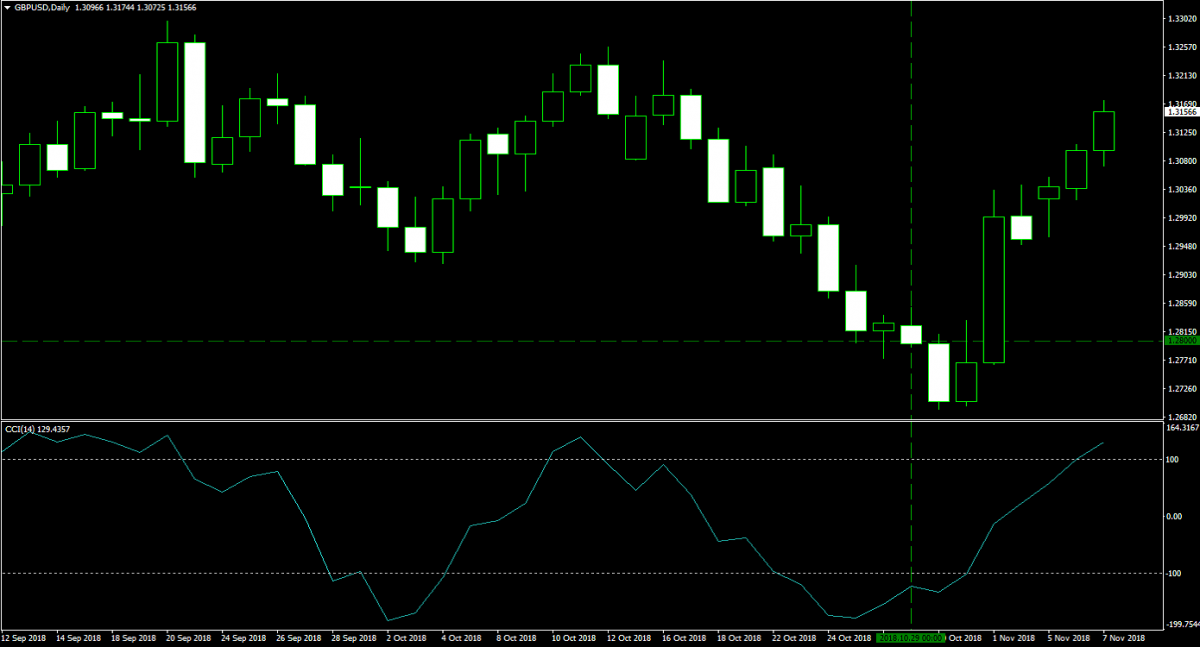
I also had a long position in the GBPUSD, 40 lots at 1.2800 with a margin requirement of $10,329 and a pip value of $400.00. I continue to hold on to this position, but placed my stop loss order at 1.3100 which will guarantee me a profit of 300 pips or $120,000. This position currently carries a floating profit of $144,000. I think we may push a bit higher and form a double top chart pattern which will trigger my current take profit level of 1.3250. Regardless of what price action does from here, I have a minimum profit of 300 pips. The below image shows my open position.
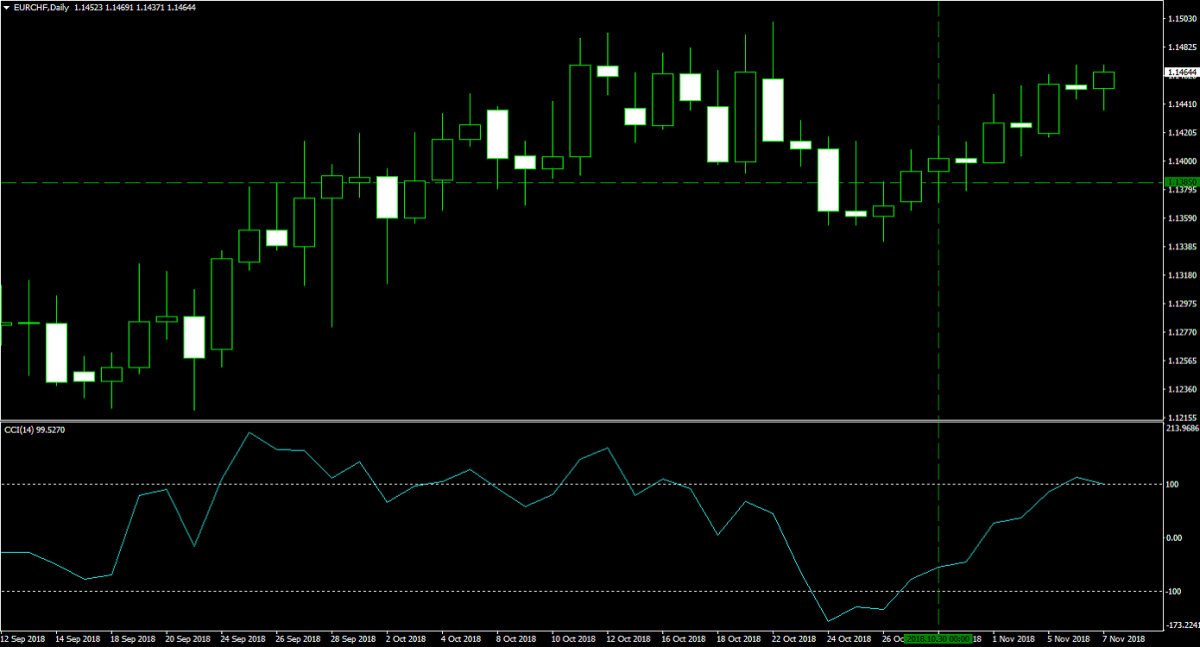
The final trade I kept open last week and which I continue to hold is a long position in the EURCHF. I purchased 40 lots at 1.1385 and my margin requirement was $9,124 with a pip value of $401.23. I set my take profit level at 1.1485 and adjusted my stop loss level to 1.1450 which will ensure me at least 50 pips in profits or $20,060. This trade currently carries a floating profit of $26,000 and the below image shows my entry level into this long position.
As you know by know I have two long-term assets in my portfolio as part of my diversification strategy. They consist of 1,000 Ether which I bought at $190 as well as 100 lots of Gold which I added to my portfolio at $1,195. I keep Ether in my Ethereum wallet which is separate of my forex trading account. My Ether asset is currently worth almost $214,000. I currently don’t plan to add to this holding, but if price action drops below my entry level I will take another look in order to determine if I should add to it or not. The most likely outcome is that I will sell part of my Ether in order to purchase another cryptocurrency.
I moved Gold into my forex sub-account in order to be isolated from my forex trades. The margin requirement was $123,179 and each pips is worth $100. In the case of Gold, each pip refers to one cent which means a $1 move in the price of Gold is worth $10,000. I moved an additional $250,000 of cash into the account in order to support he position and possible add to it. My current Gold portfolio is worth about $447,000. I do see the price of Gold appreciating further from here and mentioned a price target of $1,500.
I didn’t take any new forex positions over the past few days as I wanted the storm of the US mid-term elections to pass. I want to wrap this up with a portfolio summary. My long-term assets total $661,000 and I have $565,899 in cash. My three open forex position carry a total net worth of roughly $169,000. My total portfolio is therefore worth $1,395,899 which is up $294,076 as compared to last week Wednesday, October 31st 2018. I want to stress again that it is very important to not get wrapped up in earning money, it will follow if you take care of the learning part first.


