
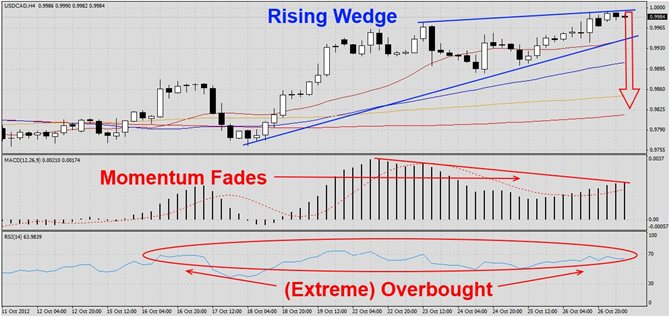
The USDCAD has rallied from its lows and formed a rising wedge formation as visible in this H4 chart. The last three candlestick patterns have formed at the top of the formation which hints that a breakdown is imminent. MACD shows that momentum has faded during the last part of the rally. Watch out for a breakdown into bearish territory as the formation collapses. RSI has been trading in and out for extreme overbought and overbought territory while it also formed a negative divergence. We recommend taking a short position at...
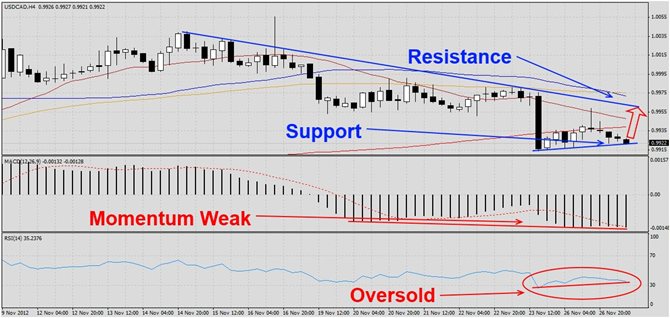
The USDCAD has been on the decline since it hit its most recent high as visible in this H4chart. The pair has briefly breached its 200 DMA to the downside and the last few sessions have attempted to form a temporary bottom just below that which formed an ascending support line. This pair should rally into its descending resistance line. MACD has been extremely weak and formed a negative divergence which suggests potential future losses after a brief rally. RSI has reached oversold territory and has improved from extreme...
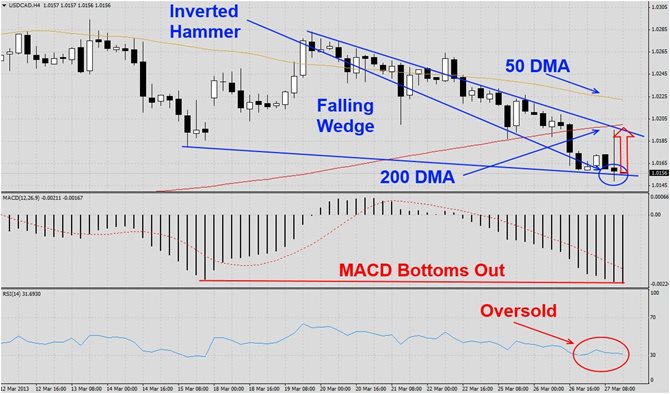
The USDCAD has been in a corrective phase for several trading sessions as visible in this H4 chart. This currency pair has formed a falling wedge formation and price action has been centered around support levels. The latest candlestick has formed an inverted hammer and we believe this pair will move higher back into its declining resistance level and possibly into its descending 50 DMA. MACD has bottomed out and confirmed the correction. Selling pressure has dropped below its moving average and we expect levels to adjust...
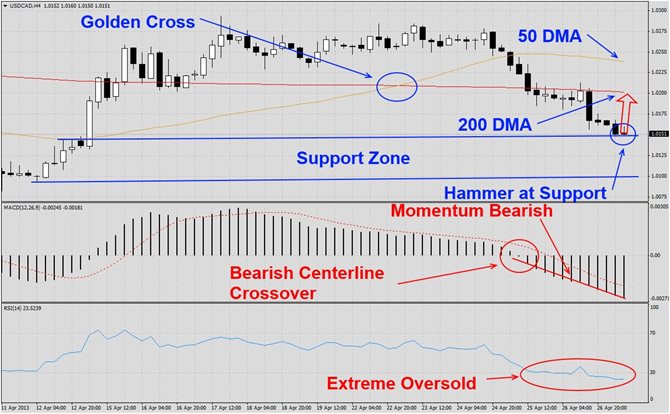
The USDCAD has started to correct due to weaker than expected economic data out of the U.S. as visible in this H4 chart. This currency pair has now reached the upper band of its support zone. The Golden Cross, a lacking indicator, suggest a general bullish sentiment. Having said that we believe this currency pair is due for one final bounce into its 200 DMA before starting a bigger descend which will take this pair below parity. The latest candlestick has formed a hammer formation at support and we expect a minor rally before the...
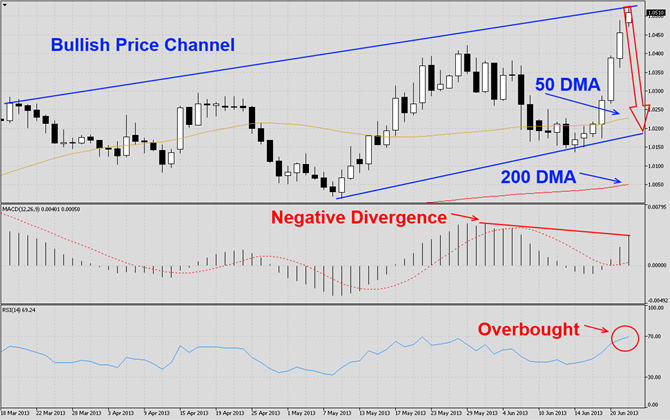
The USDCAD has entered a sharp rally over the past seven trading days as visible in this D1 chart. This currency pair has formed a bullish price channel which is a bullish chart formation, but has now approached its ascending resistance level. The upward move was too strong and too fast which make sit prone to a correction. We believe this pair will correct back down to its ascending support level before it makes another move higher. MACD has completed a bullish centerline crossover which confirms the bullish chart formation,...