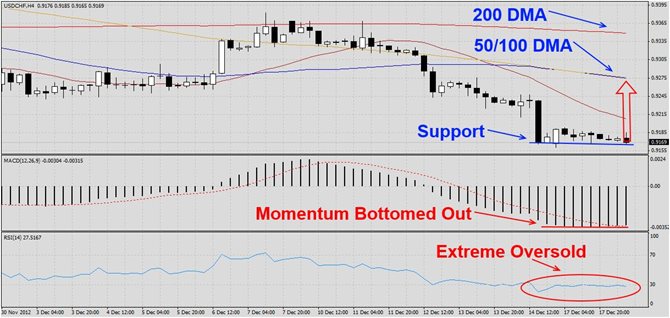
The USDCHF has corrected after it ran into its 200 DMA and currently dances around its new temporary support level as visible on this H4 chart. The last ten candlestick patterns have indicated a new support level and we believe this pair will use it to launch a small rally. MACD confirms the formation of a new support level and RSI has traded in extreme oversold territory for an extended period of time. Look out for a breakout into oversold territory and above which should accelerate the rally. We recommend taking a long position...

We witnessed a very violent week for any Japanese Yen related trade. The currency has been in free fall over the past few weeks and is caught in crossfire from the world’s two weakest economies, the ugly stepsister Japan and U.S., which has pressured the Yen against all major trading partners. Japan enjoys its weak Yen as it makes exports cheaper for them. Please view or update on the Japanese Yen we posted for all open trades related to that currency (Japanese Yen Update). In other news Mario Monti announced his resignation (Monti...

The Japanese Yen has been dropping for several weeks without looking back. We have focused our attention on three Japanese Yen pairs, the USDJPY, CADJPY and the AUDJPY. We have issued several trading recommendations on the short side for all three pairs. Those traders who have entered short positions with a stop loss level have already accepted a loss and are out of all Yen related trades. We do not use stop loss levels and continue to maintain all open Yen short positions. While many beginners may view it as a wrong trade, we were...
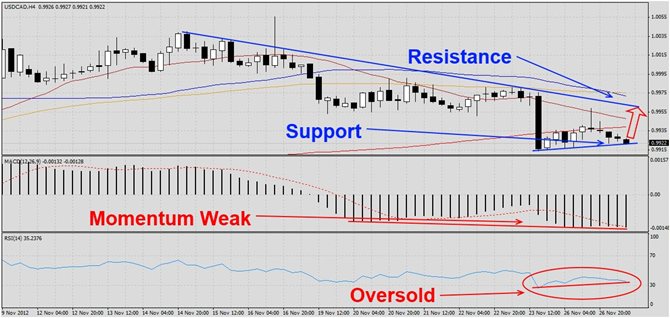
The USDCAD has been on the decline since it hit its most recent high as visible in this H4chart. The pair has briefly breached its 200 DMA to the downside and the last few sessions have attempted to form a temporary bottom just below that which formed an ascending support line. This pair should rally into its descending resistance line. MACD has been extremely weak and formed a negative divergence which suggests potential future losses after a brief rally. RSI has reached oversold territory and has improved from extreme conditions...

USDCAD reverses into a bearish trend Resistance Levels Support Levels R3: 0.9844 R2: 0.9830 R1: 0.9808 S1: 0.9772 S2: 0.9758 S3: 0.9736 For intraday bias, the USDCAD is now showing a slight bearish reversal in its candlestick sentiment, as prices are showing bearish traction in its movement. Currently, prices are now moving at 0.9767 and already penetrated its key support line of 0.9772. Its RSI (14) indicates that prices are...