The EURUSD has been trading in a bullish price channel as visible in this H4 chart. This currency pair started to form this chart pattern after it hit new multi-month as well as 2013 lows due to the Cypriot bailout situation. The establish chart pattern has been very strong and we believe the EURUSD currency pair will move higher back into its ascending resistance. MACD has shown severe improvement and currently flirts with a bullish centerline crossover. RSI has reached oversold territory, but managed higher lows and confirm the...
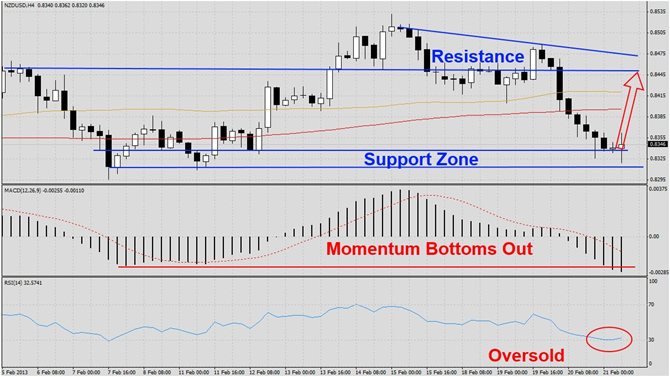
The NZDUSD has corrected sharply as visible in this H4 chart and currently trades around its support zone. The reason for the recent collapse was comments by the New Zealand Central Bank which would like to see a weaker Kiwi. We believe the correction was overdone and due for a bounce back into resistance. MACD has bottomed out at roughly the same level as its previous decline to this level and formed a double bottom. RSI is trading in oversold territory and a breakout from this level should add to the rally back to resistance....

The AUDJPY has traded higher over the past few months and formed a bullish price channel as visible in this D1 chart. This currency pair has reached the top of its chart formation and over the past six trading sessions this pair has attempted to form a top. We believe this forex pair will correct down to its ascending support line which is enforced by its ascending 50 DMA. MACD has not confirmed the bullish price channel and formed a negative divergence as momentum fades away. RSI has formed a negative divergence as well and...

The GBPCHF has corrected after it reached a new high and the decline was halted by its support zone as visible in this H4 chart. This pair should start a rally which may be limited to its 200 DMA. The GBPCHF may correct slightly lower until it forms a double bottom formation. MACD indicates bearishness, but has reached a temporary bottom from where it should improve alongside the rally. RSI has been trading in oversold territory and a breakout should fuel the rally. We recommend a long position at 1.4760 with a potential second...

The EURAUD has formed a narrow head-and-shoulders reversal pattern as visible in this H4 chart. We believe this pair will initiate a sharp deterioration and breakdown below its 200 DMA by a significant amount. MACD has indicated that momentum has been fading out of this trade and we expect a bearish centerline crossover to be visible shortly after the correction has begun. RSI shows that the overall strength of this pair has been on the decline and currently trades in overbought territory. We recommend an initial short position at...