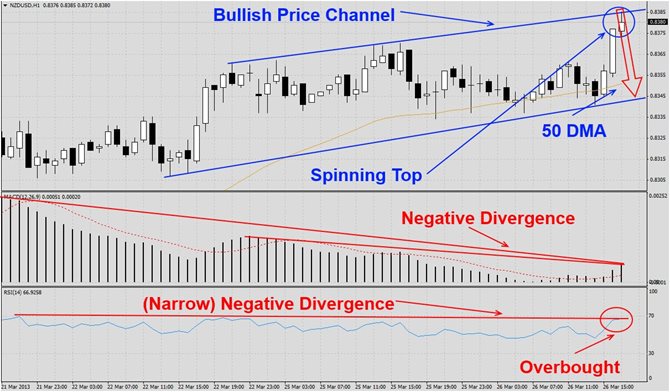
The NZDUSD has rallied over the past few trading sessions and formed a bullish price channel as visible in this H1 chart. Price action has run into its ascending resistance level and the most recent candlestick has formed a spinning top at resistance. We believe this currency pair will correct down to its ascending support level. MACD has not confirmed the bullish chart patterns and formed a negative divergence. We may witness a bearish centerline crossover over the next few trading days. RSI has formed a very narrow negative...
The NZDUSD has been trading in a range and has recently corrected lower from resistance levels as visible in this D1 chart. This currency pair has formed a double bottom formation and we expect it to rally back into its 50 DMA and potentially back into its resistance level. Furthermore, the last candle stick formed a spinning top at its ascending 200 DMA which acts as additional support. MACD has remained bearish which we expect to turn around as this pair starts to move higher. RSI is trading in oversold territory and a breakout...
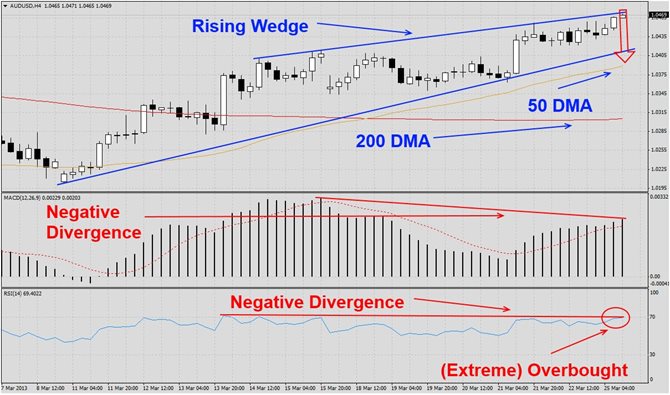
The AUDUSD has rallied after hitting multi-week lows and formed a rising wedge formation as visible in this H4 chart. The bearish chart pattern has been strong and not been violated. We expect this currency pair to correct down to its ascending support level and potentially initiate a breakdown into its ascending 50 DMA with the next support level being at its 200 DMA. MACD has confirmed the bearish chart pattern and formed a negative divergence. RSI has confirmed the bearish chart formation as well with a negative divergence of...

The NZDUSD has extended its rally as visible in this D1 chart. This extension was fueled primarily by the US debt ceiling debate as well as government shutdown which has further pressured the USD. This currency pair has now formed two bearish chart patterns; a rising wedge formation as well as a double top formation. We expect the NZDUSD to correct as soon as this week which should lead to a breakdown of it ascending support level and this currency pair could drop down to its 200 DMA. MACD has not confirmed the extension of the...

The EURUSD has corrected sharply after Cyprus has reignited Eurozone woes. This currency pair now formed a double bottom as visible in this D1 chart and the most recent candlestick has opened above its support level which is enforced by its 200 DMA and a close above this level will be bullish. We believe the EURUSD will launch a relief rally into its 50 DMA after the Cyprus vote on the bailout. MACD has stabilized at the bottom and formed a positive divergence which supports our call for a rally from current levels. RSI is trading...