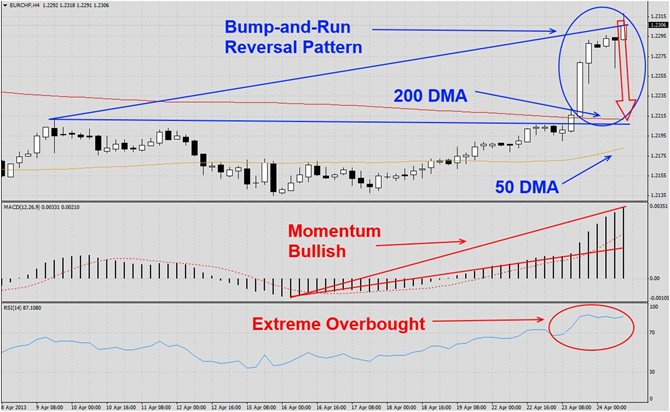
The EURCHF has launched a strong rally from its multi-week lows as visible in this H4 chart. This currency pair has launched a bump-and-run reversal pattern with the latest candlestick pattern formed indicates a potential capitulation spike higher. We call this pair for a correction back down to its 200 DMA, before a potential bigger upturn may be attempted. MACD has indicated strong bullish momentum, but RSI is trading in extreme overbought territory at very unsustainable levels. A pullback down to its 200 DMA would confirm a...

The AUDUSD has corrected from a multi-month high as visible in this H4 chart. This currency pair has formed a falling wedge formation and currently trades around its descending support level of its bullish chart pattern. We believe this pair will move higher and back into its 200 DMA which means it will breakout from it falling wedge formation. MACD has formed a positive divergence and does not confirm the lower lows set by the AUDUSD. This is another bullish development. RSI has formed a positive divergence as well and also...

Earlier this week it was reported that BRICS, which stands for Brazil, Russia, India, China and South Africa, has agreed on a $100 Billion fund in order to combat fiscal malpractice by the developed world and counter associated negative impacts on currency markets (BRICS Collaboration and Currency Markets). BRICS has over $4.4 Trillion in currency reserves, but not the attributable financial influence in the global arena which caused BRICS to stand by and accept the negative impacts of developed world mistakes. The creation of this $...
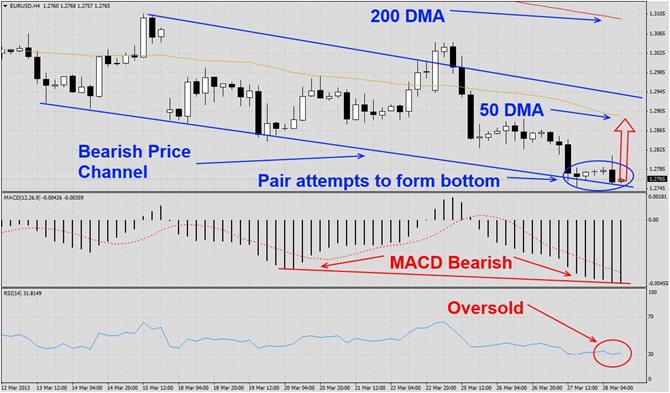
The EURUSD has been correcting in a well-established bearish price channel as visible in this H4 chart. The bearish chart pattern has been very strong and not violated while price action is currently centered on its descending support level. The last six candlesticks suggest this currency pair is attempting to form a bottom at 2013 lows from where we expect it to move higher and keep the chart pattern intact. MACD has confirmed the bearish chart pattern which points to potential future weakness. The rally which will be initiated...
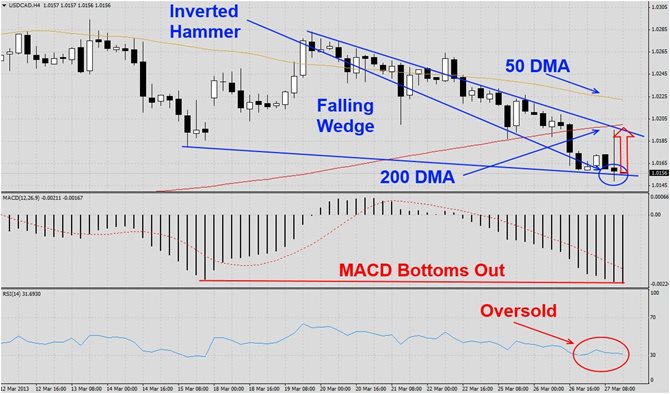
The USDCAD has been in a corrective phase for several trading sessions as visible in this H4 chart. This currency pair has formed a falling wedge formation and price action has been centered around support levels. The latest candlestick has formed an inverted hammer and we believe this pair will move higher back into its declining resistance level and possibly into its descending 50 DMA. MACD has bottomed out and confirmed the correction. Selling pressure has dropped below its moving average and we expect levels to adjust higher...