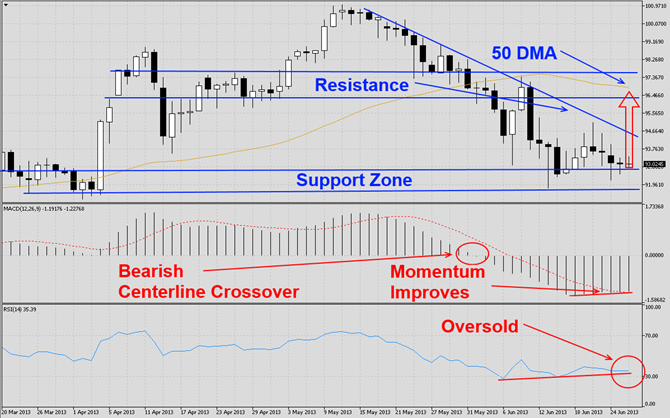
The CADJPY has corrected sharply as visible in this D1 chart. It has broken down below its 50 DMA and the correction has been halted by this currency pair’s strong support zone. The Japanese Yen has rallied strongly over the past four weeks and we expect traders to lock in profits which will start a short covering rally and push this currency pair past its descending resistance line and back towards horizontal resistance levels which are enforced by its 50 DMA. MACD has completed a bearish centerline crossover, but bearish...
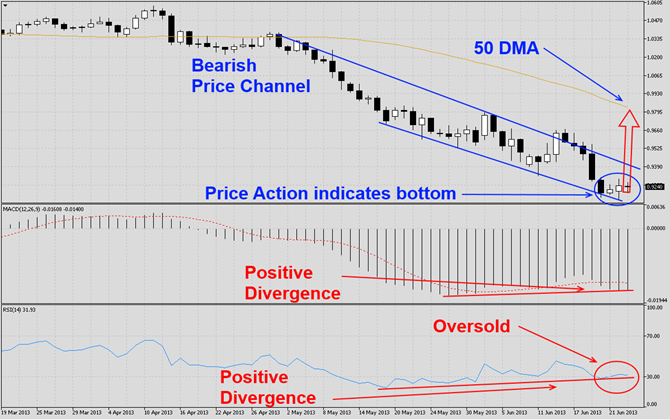
The AUDUSD has been correcting for several weeks as visible in this D1 chart and broke parity which has caused this currency pair to be one of the biggest decliners in the second-quarter. This currency pair has formed a bearish price channel which is a bearish chart formation. The bearish price channel has been very narrow and makes it vulnerable to break-outs. Price action has indicated that this currency pair currently attempts to form a bottom which is supported by the formation of the last three daily candlesticks. We expect a...
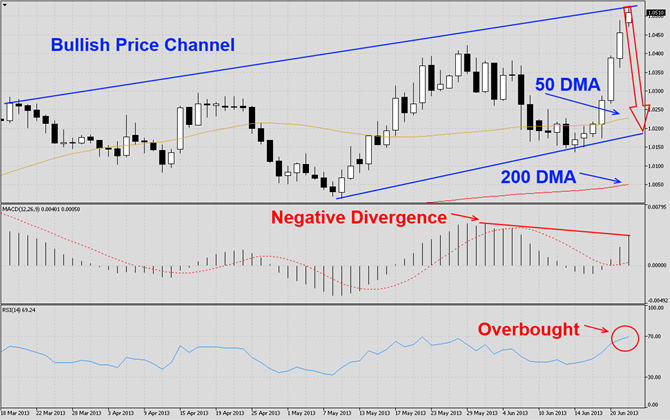
The USDCAD has entered a sharp rally over the past seven trading days as visible in this D1 chart. This currency pair has formed a bullish price channel which is a bullish chart formation, but has now approached its ascending resistance level. The upward move was too strong and too fast which make sit prone to a correction. We believe this pair will correct back down to its ascending support level before it makes another move higher. MACD has completed a bullish centerline crossover which confirms the bullish chart formation, but...
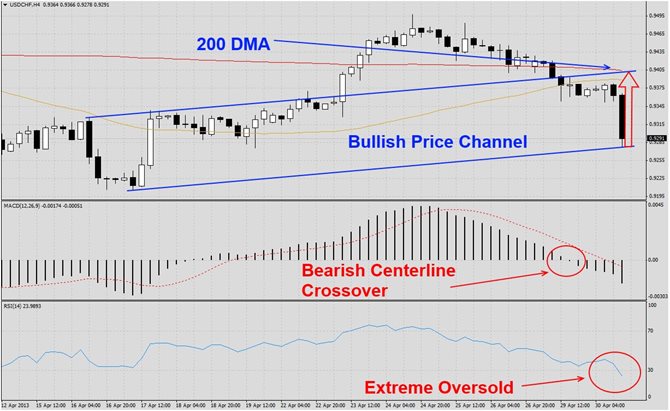
The USDCHF has dropped from its latest peak as visible in this H4 chart and broken through support levels posed by its 50 DMA as well as 200 DMA as well as its ascending support line turning them into resistance. This currency pair has corrected too much too fast and its drop was halted by another ascending support level and has now formed a bullish price channel. We believe this pair will attempt to rally from back into its new resistance levels in order to retest and confirm them. MACD has completed a bearish centerline...

The AUDCHF has been trading in a rectangular chart pattern as visible in its H4 chart. This currency pair then launched a sharp rally and formed a bump-and-run reversal pattern which points to future consolidation. The last two candlestick patterns formed a hammer as well as inverted hammer around the most recent top which is another bearish indicator. MACD has confirmed the rally and remained strong through the advance. Look out for a potential shift in momentum to the downside as the correction unfolds. RSI has been trading in...