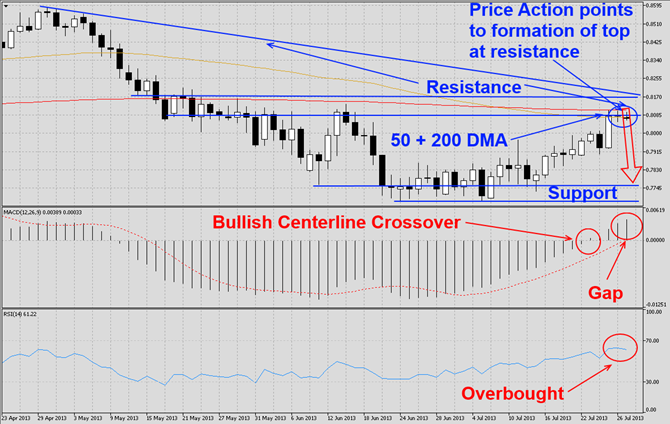
The NZDUSD has rallied from strong support levels as visible in this D1 chart. This currency pair has now ran into quadruple resistance which is made-up of its 50 DMA, 200 DMA, strong horizontal resistance as well as descending resistance from its previous high. Price action indicates that this currency pair is forming a top as the last two daily candlestick patterns formed a star as well as inverted hammer and we expect it to correct back to support levels. MACD completed a bullish center crossover which we expect to reverse as...
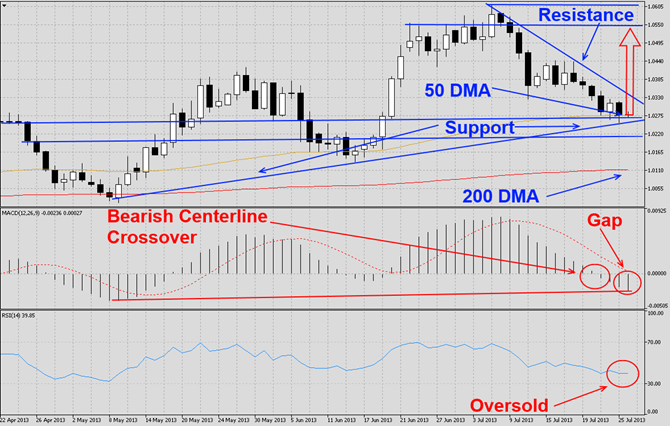
The USDCAD has corrected after it reached a multi-month high as visible in this D1 chart. This currency pair has moved lower and currently rests at solid horizontal as well as ascending support levels which are also enforced by its 50 DMA. We believe the USDCAD will attempt a rally as well as a breakout of its descending resistance level and move higher to either form a head-and-shoulders reversal pattern or a double top, both of which are bearish chart formations. MACD has completed a bearish centerline crossover which we believe...

The USDCHF has corrected sharply as visible in this H4 chart. This currency pair has made several attempts to rally higher which all failed and therefore the USDCHF is stuck in a rectangular chart pattern and is currently trading at horizontal support levels while at the same time facing strong descending resistance levels. We believe this currency pair will be able to launch a breakout and rally back to horizontal resistance levels. MACD has showed improvement over the past few trading weeks and is approaching the centerline where...

The AUDNZD has continued its contraction and maintained its falling wedge formation as visible in this D1 chart. This currency pair is now trading at its descending support level of its bullish chart pattern and we expect it to stabilize and attempt a rally which would first take it back to a strong support level which turned resistance. A breakout from here should take this currency pair back to its descending 50 DMA. MACD has confirmed the last leg of the sell-off, but starts to bottom out and did not drop below the previous lows...

The AUDNZD has corrected over the past few trading weeks as visible in this D1 chart. This currency pair has formed a narrow falling wedge formation which makes a breakout very likely. The descending resistance level is enforced by its declining 50 DMA and should the AUDNZD successfully complete a breakout the path would be clear to rally into its descending 200 DMA. MACD has confirmed the contraction of the AUDNZD, but formed a positive divergence which suggests a pending trend reversal. We expect MACD to complete a bullish...