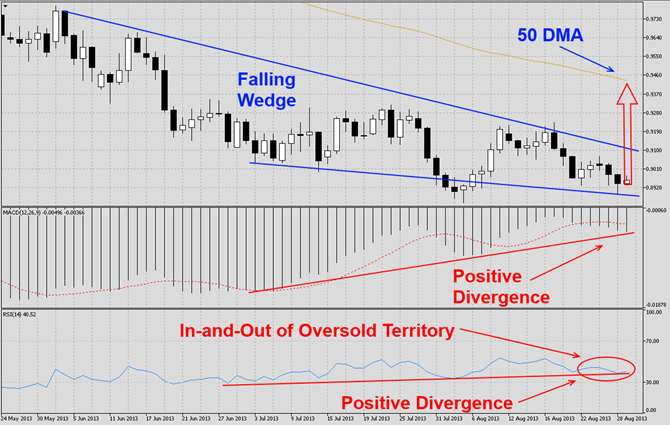
The AUDUSD has been under pressure for several trading months as visible in this D1 chart. This currency pair has broken down through all major support levels and corrected over 1,600 pips, but has now formed a falling wedge formation which is a bullish chart pattern. We expect this currency pair to launch a breakout from its current bullish chart pattern and rally back into its ascending 50 DMA. A breakout above that level would clear the way for another run at parity. MACD has shown improvement in momentum during the sharp sell-...
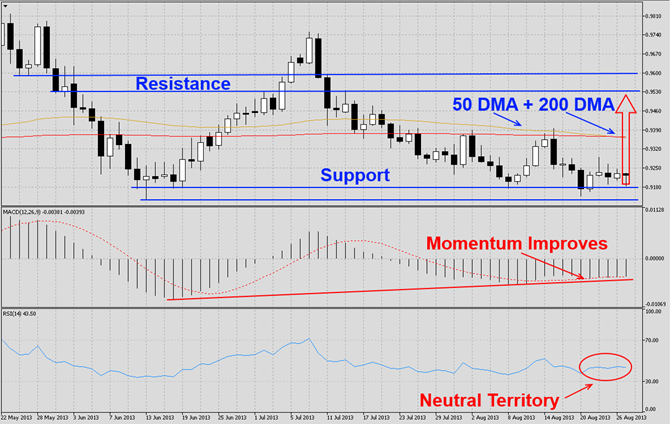
The USDCHF has reversed it previous attempt to move higher after it touched its 200 DMA as visible in this D1 chart. This currency pair has now retraced back down to its very strong horizontal support level from which we expect another attempt to move higher and breakout above its 50 DMA as well as 200 DMA and back into its horizontal resistance level. MACD continues to show improvement as it approaches the histogram as well as moving average continue to approach the centerline. We expect a bullish centerline crossover to occur...
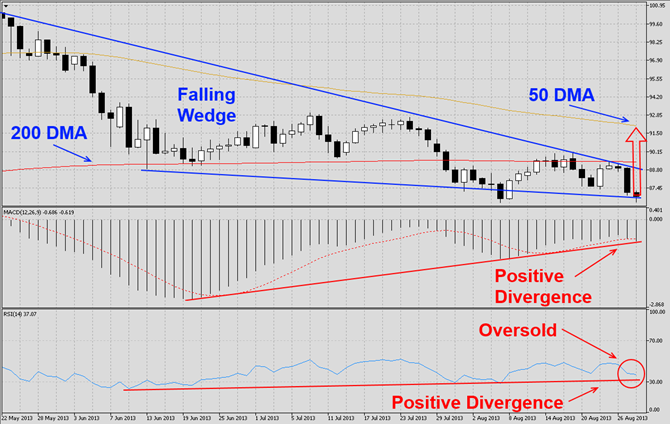
The AUDJPY has been correcting for several trading weeks as visible in this D1 chart. This currency pair has now formed a falling wedge formation which is a bullish chart pattern. Today’s low also formed a higher low than the previous one which is another bullish sign. We expect this pair to breakout above its current chart formation and attempt a bullish run which may take it above its 50 DMA. MACD has indicated that momentum has improved along the way and formed a positive divergence which is another bullish sign. We expect a...

The EURNZD has launched a massive rally over the past few trading weeks as visible in this D1 chart. After this currency pair broke-out above its 200 DMA it rallied as expected before it corrected back down to its ascending support level from where it bounced higher and now formed a double top formation which is a bearish chart pattern. We believe this currency pair will correct and break-down below its ascending support level and back down to its 200 DMA. MACD indicates that momentum has been fading during the rally and has...

The GBPUSD has rallied from its strong support zone as visible in this D1 chart. This currency pair has now reached a very strong resistance zone and price action is currently trapped between the lower band of its resistance zone and its 200 DMA. A breakout into its resistance zone is possible and if this currency pair reaches the top of its zone it will also form a double top which is a bearish chart pattern. We expect this currency pair to correct before breaking out of its resistance zone; the correction should form a higher low...