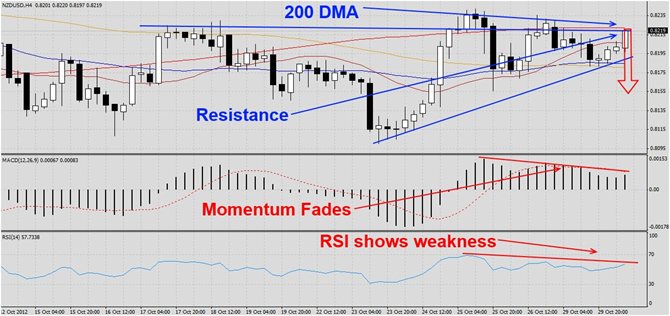
The NZDUSD has rallied from its lows as visible in this H4 chart. The rally was halted by double resistance. The first resistance comes from its previous highs which caused this pair to correct to the lows from which it launched its current rally. The second resistance is provided by its 200 DMA. MACD shows that momentum has faded during the recent rally which does not support any future move higher. RSI has showed the same weakness, but has not yet reached overbought territory. Despite that this pair is prepared to move lower...
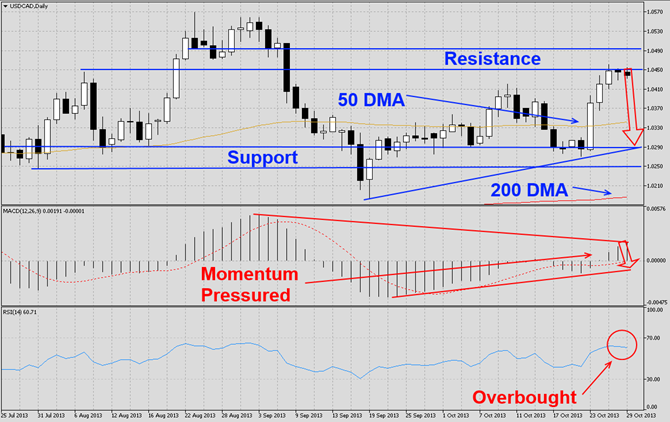
The USDCAD has rallied after briefly piercing its horizontal support level as visible in this D1 chart. This currency pair is now trading at its horizontal resistance level and should start to correct back down to its horizontal support level which is also enforced by its ascending support level. A breakdown could open the way down to its ascending 200 DMA. MACD indicates that momentum is pressured inside a triangle formation which should lead to a breakdown of momentum and potentially a bearish centerline crossover. RSI is...
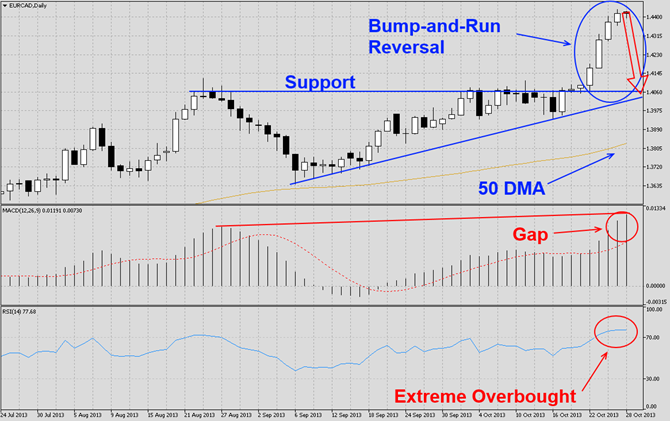
The EURCAD has rallied strongly and broke out above its resistance-turned-support level as visible in this D1 chart. This currency pair has now formed a bump-and-run reversal pattern and we expect the EURCAD to correct back down to its new support level which is also enforced by its ascending support level. MACD shows a gap between the histogram as well as the moving average and we expect the gap to close and the histogram to start trading below its moving average as the correction unfolds. RSI is trading in extreme overbought...

The CADJPY has corrected from a double top as visible in this H4 chart and the decline was halted by quadruple support levels. This pair has a solid foundation to launch a rally from these levels. The rally may be halted by its 50 DMA. MACD showed momentum turned bearish during the last correction and may be the last indicator to turn bullish. RSI has reached oversold territory; watch out for a breakout from this condition which would be a very bullish sign. We recommend taking an initial long position at 79.75 with a potential...
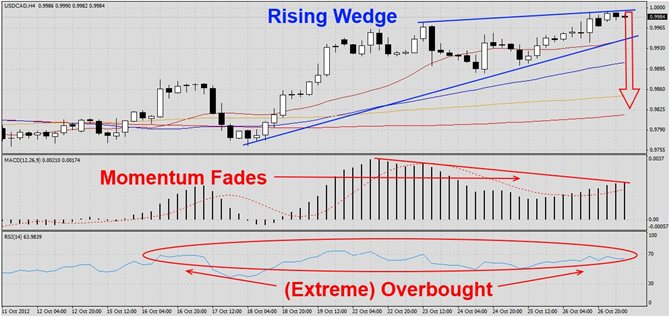
The USDCAD has rallied from its lows and formed a rising wedge formation as visible in this H4 chart. The last three candlestick patterns have formed at the top of the formation which hints that a breakdown is imminent. MACD shows that momentum has faded during the last part of the rally. Watch out for a breakdown into bearish territory as the formation collapses. RSI has been trading in and out for extreme overbought and overbought territory while it also formed a negative divergence. We recommend taking a short position at 0....