
A quieter week came to an end and PaxForex closed the week with 200 pips which brought our monthly total to above 1,200 pips with four trading days plus Friday left for the October period. We did close one of our AUDCHF long positions for a loss of 750 pips on October 21st as we continue to adjust our exposure to the Australian Dollar. The long awaited non-farm payroll report out of the US was released on October 22nd and showed a worse than expected increase of 148,000 jobs while the unemployment rate dropped 0.1% to 7.2%. This...

The AUDJPY has completed a minor bounce after correcting from its horizontal resistance zone as visible in this D1 chart. This currency pair is now trading at the lower band of its resistance zone and we believe it will breakdown from current levels and correct into its horizontal support zone which is enforced by its 200 DMA. MACD indicates that momentum is fading and the histogram as well as moving average are approaching the centerline. We expect a breakdown to occur as this currency pair completes its correction. RSI is trading...

The NZDUSD has rallied from strong support levels and formed a triple top as visible in this D1 chart. This currency pair has now formed a triple top formation which is a bearish chart pattern and trades at upper resistance levels. We expect this currency pair to reverse and launch a correction from current levels and back into the upper band of its horizontal support zone. MACD indicates a gap has formed between its histogram which is now in bullish territory and its moving average which remains in bearish territory. We expect...

The EURUSD has continued its rally as visible in this H4 chart and formed a rising wedge formation. This pair currently trades at the top of its range and the last five candlestick patterns formed either hammers or inverted hammers as the EURUSD tries to form a major top. Friday’s U.S. Non-Farm Payroll report should provide the spark for a major correction. MACD has formed a negative divergence while it spent the entire rally in bullish territory. RSI has traded from extreme overbought territory and formed a negative divergence as...
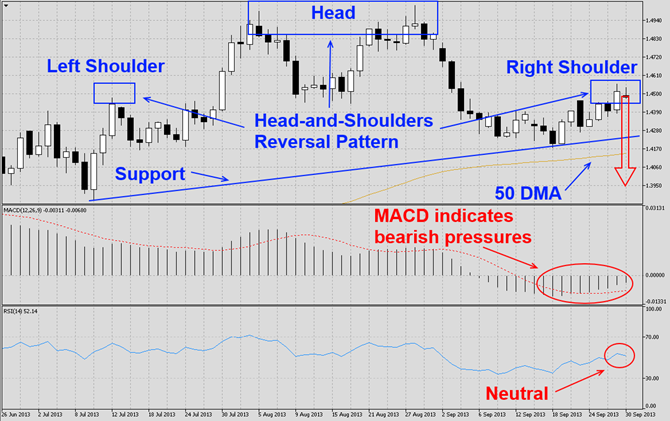
The EURAUD has bounced after approaching its 50 DMA as visible in this D1 chart. This currency pair has now formed a head-and-shoulders pattern which is a reversal pattern and indicates that the EURAUD is due for a larger correction which could lead to a breakdown of its 50 DMA and a bigger correction. We expect this currency pair to breakdown below the 1.4000 level. MACD has dropped into bearish territory with both the histogram as well as the moving average trading below its centerline and we expect this scenario to remain...