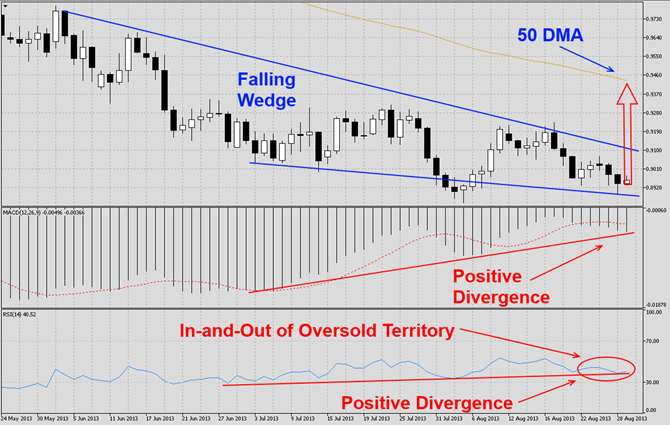

The AUDUSD has been under pressure for several trading months as visible in this D1 chart. This currency pair has broken down through all major support levels and corrected over 1,600 pips, but has now formed a falling wedge formation which is a bullish chart pattern. We expect this currency pair to launch a breakout from its current bullish chart pattern and rally back into its ascending 50 DMA. A breakout above that level would clear the way for another run at parity. MACD has shown improvement in momentum during the sharp sell-...

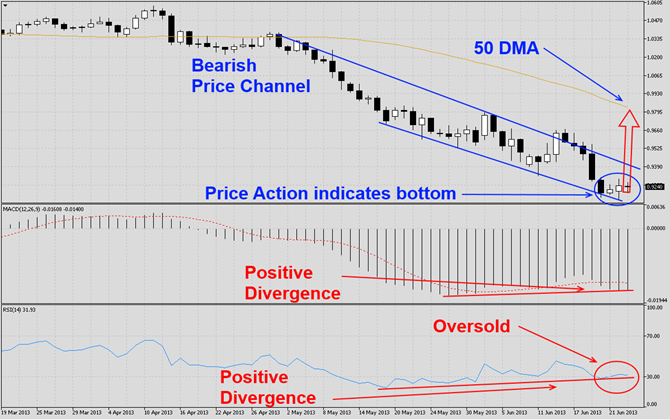
The AUDUSD has been correcting for several weeks as visible in this D1 chart and broke parity which has caused this currency pair to be one of the biggest decliners in the second-quarter. This currency pair has formed a bearish price channel which is a bearish chart formation. The bearish price channel has been very narrow and makes it vulnerable to break-outs. Price action has indicated that this currency pair currently attempts to form a bottom which is supported by the formation of the last three daily candlesticks. We expect a...
The AUDUSD has corrected from a multi-month high as visible in this H4 chart. This currency pair has formed a falling wedge formation and currently trades around its descending support level of its bullish chart pattern. We believe this pair will move higher and back into its 200 DMA which means it will breakout from it falling wedge formation. MACD has formed a positive divergence and does not confirm the lower lows set by the AUDUSD. This is another bullish development. RSI has formed a positive divergence as well and also...

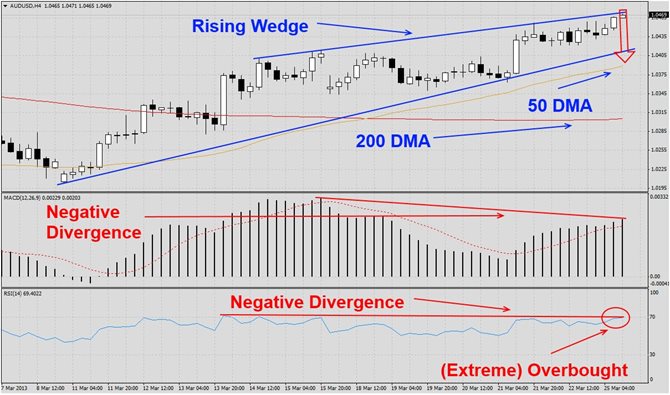
The AUDUSD has rallied after hitting multi-week lows and formed a rising wedge formation as visible in this H4 chart. The bearish chart pattern has been strong and not been violated. We expect this currency pair to correct down to its ascending support level and potentially initiate a breakdown into its ascending 50 DMA with the next support level being at its 200 DMA. MACD has confirmed the bearish chart pattern and formed a negative divergence. RSI has confirmed the bearish chart formation as well with a negative divergence of...