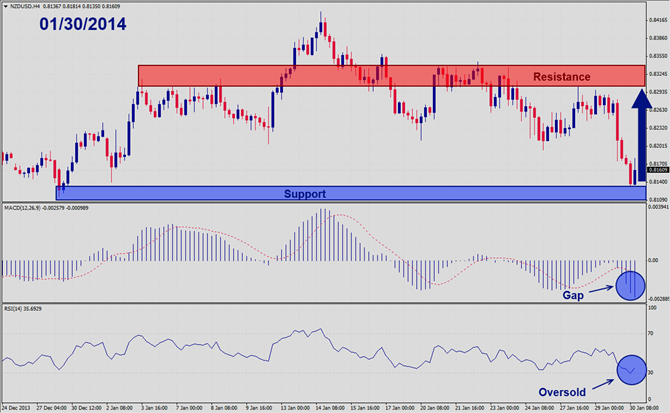

Should price action for the NZDUSD remain inside the 0.8150 to 0.8200 zone the following trade set-up is recommended: Timeframe: H4 ...

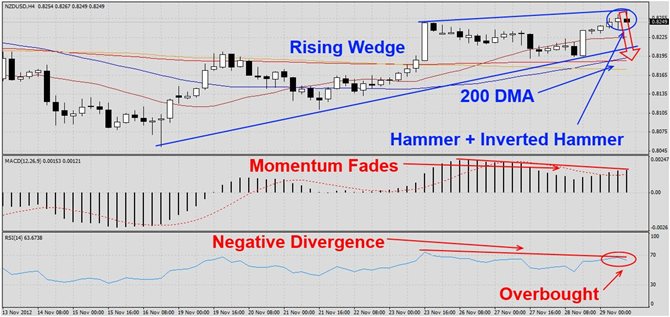
The NZDUSD has rallied from its most recent lows and formed a rising wedge formation as visible in this H4 chart. The pair currently trades at the upper resistance level and the two most recent candlestick patterns formed a hammer as well as inverted hammer formation which are both two extremely bearish signs given their position. MACD has formed a negative divergence and shows that momentum fades away. We expect this pair to breakdown into its 200 DMA. RSI has reached overbought territory and formed a negative divergence as well...

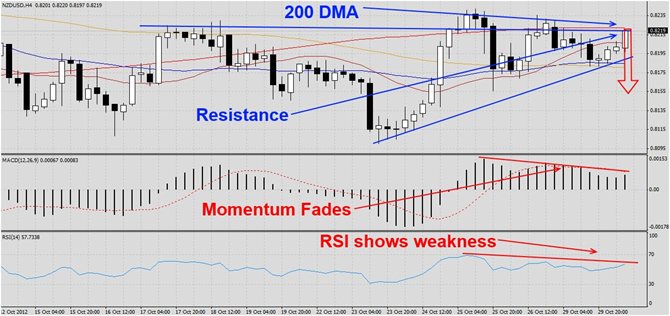
The NZDUSD has rallied from its lows as visible in this H4 chart. The rally was halted by double resistance. The first resistance comes from its previous highs which caused this pair to correct to the lows from which it launched its current rally. The second resistance is provided by its 200 DMA. MACD shows that momentum has faded during the recent rally which does not support any future move higher. RSI has showed the same weakness, but has not yet reached overbought territory. Despite that this pair is prepared to move lower...
The NZDUSD has rallied from strong support levels and formed a triple top as visible in this D1 chart. This currency pair has now formed a triple top formation which is a bearish chart pattern and trades at upper resistance levels. We expect this currency pair to reverse and launch a correction from current levels and back into the upper band of its horizontal support zone. MACD indicates a gap has formed between its histogram which is now in bullish territory and its moving average which remains in bearish territory. We expect...

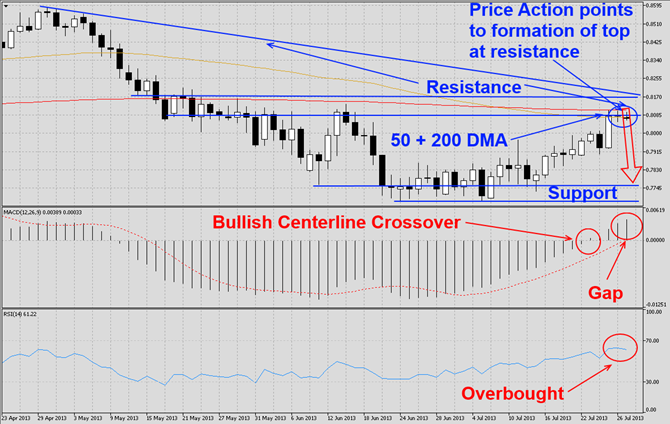
The NZDUSD has rallied from strong support levels as visible in this D1 chart. This currency pair has now ran into quadruple resistance which is made-up of its 50 DMA, 200 DMA, strong horizontal resistance as well as descending resistance from its previous high. Price action indicates that this currency pair is forming a top as the last two daily candlestick patterns formed a star as well as inverted hammer and we expect it to correct back to support levels. MACD completed a bullish center crossover which we expect to reverse as...