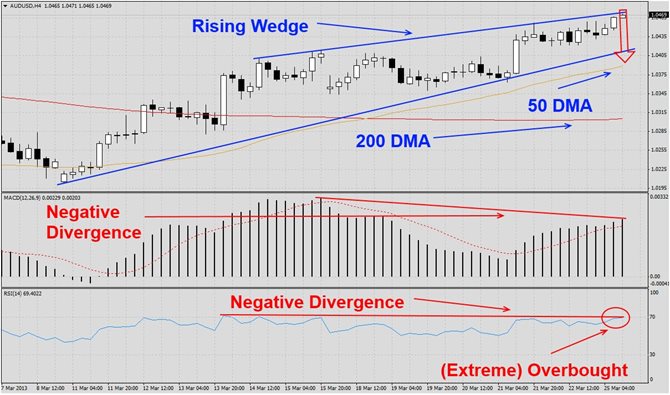

The AUDUSD has rallied after hitting multi-week lows and formed a rising wedge formation as visible in this H4 chart. The bearish chart pattern has been strong and not been violated. We expect this currency pair to correct down to its ascending support level and potentially initiate a breakdown into its ascending 50 DMA with the next support level being at its 200 DMA. MACD has confirmed the bearish chart pattern and formed a negative divergence. RSI has confirmed the bearish chart formation as well with a negative divergence...

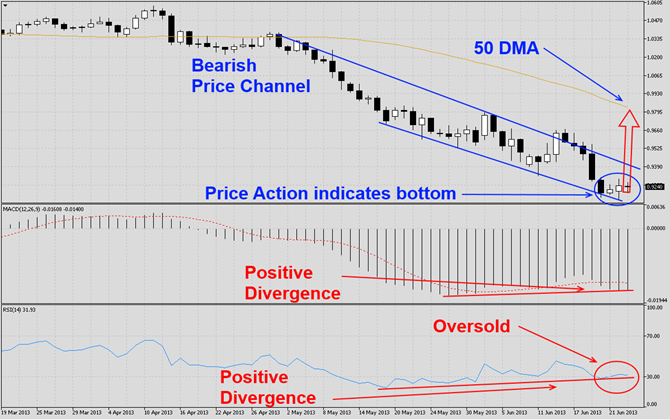
The AUDUSD has been correcting for several weeks as visible in this D1 chart and broke parity which has caused this currency pair to be one of the biggest decliners in the second-quarter. This currency pair has formed a bearish price channel which is a bearish chart formation. The bearish price channel has been very narrow and makes it vulnerable to break-outs. Price action has indicated that this currency pair currently attempts to form a bottom which is supported by the formation of the last three daily candlesticks. We expect...

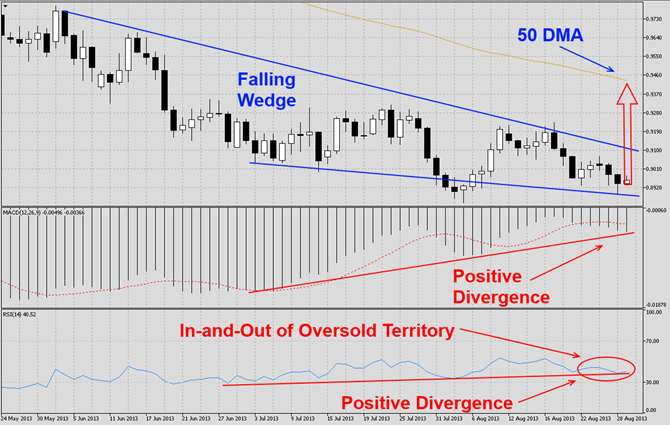
The AUDUSD has been under pressure for several trading months as visible in this D1 chart. This currency pair has broken down through all major support levels and corrected over 1,600 pips, but has now formed a falling wedge formation which is a bullish chart pattern. We expect this currency pair to launch a breakout from its current bullish chart pattern and rally back into its ascending 50 DMA. A breakout above that level would clear the way for another run at parity. MACD has shown improvement in momentum during the sharp...
Should price action for the AUDUSD remain inside the 0.8950 to 0.9000 zone the following trade set-up is recommended: Timeframe: H4 Recommendation: Short Position Entry Level: Long Position @ 0.8975 Take Profit Zone: 0.8750 – 0.8800 Stop Loss Level: 0.9100 (We will not use a stop loss order to close this trade for a loss and execute this trade as advised below). We do use stop loss orders to protect our profits and close a trade for a profit. Each trader may decide if and where they would like to place the order. Hedge...

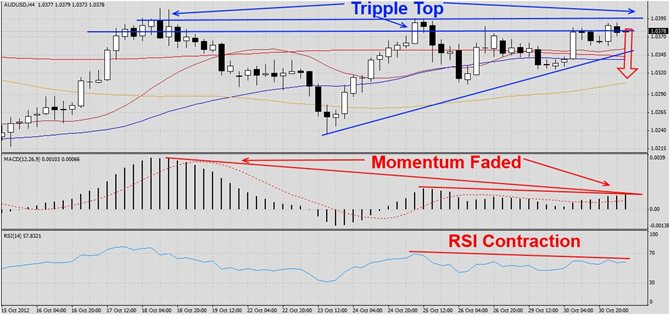
The AUDUSD has rallied from its recent low as visible in this H4 chart. The pair ran into heavy resistance as it formed a triple top formation. The first part of the triple top formation allowed this pair to break down to its 100 DMA before starting a rally that formed the second top which saw its correction stopped by the rising support line that allowed this pair to form its triple top. The next correction may cause a breakdown back to the 100 DMA. MACD shows that momentum has faded through each top and it continues to fade. RSI...