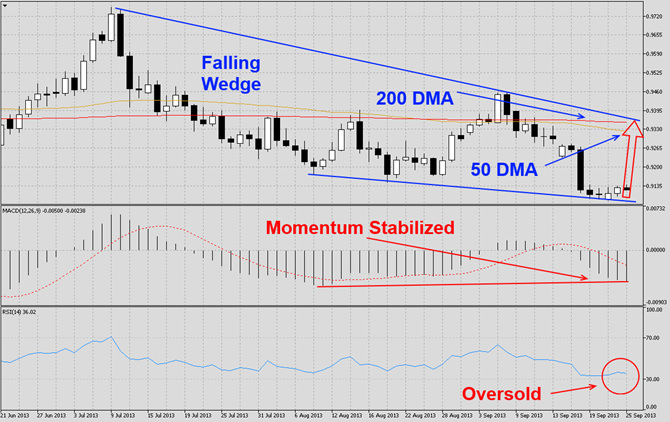
The USDCHF has corrected sharply as visible in this D1 chart. This currency pair has now formed a falling wedge formation which is a bullish chart pattern. Over the past five trading days the USDCHF has started to form a bottom as indicated by price action and the last five daily candlestick formations. We expect current support to hold and for this currency pair to launch a rally which will take it back to its 200 DMA.
MACD indicates that momentum has stabilized as the histogram has set a higher low which suggests underlying strength. We expect the histogram to move higher and approach its centerline. RSI is trading in oversold territory and a breakout should further fuel the rally.
We recommend a long position at 0.9125 with a potential second entry level at 0.9000. We also recommend a stop sell order at 0.9050 in order to hedge the initial long position and before adding new long positions to this trade.
Traders who wish to exit this trade at a loss are advised to place their stop loss level at 0.9000. We will not use a stop loss order and execute this trade as recommended. Place your take profit target at 0.9325.
Here are the reasons why we call the USDCHF currency pair higher
- The USDCHF currency pair has formed a falling wedge formation which is a bullish chart pattern
- MACD indicates momentum has stabilized and the histogram has formed a higher high
- RSI is trading in oversold territory and a breakout should further fuel the rally
- Profit taking after a strong correction in order to realize trading profits
- New long positions by intuitional swing traders
Open your PaxForex Trading Account now and add this currency pair to your forex portfolio.


