


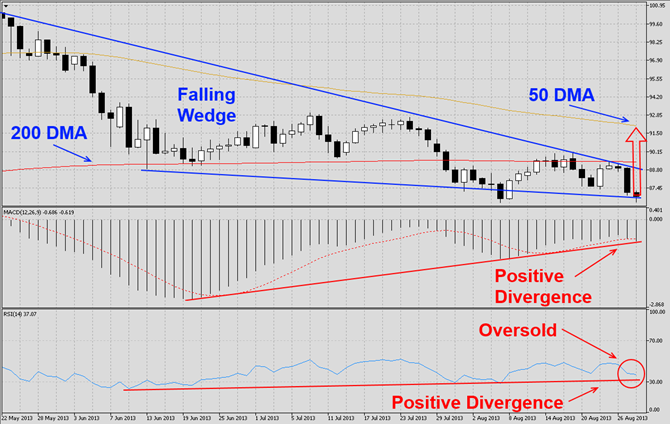
The AUDJPY has been correcting for several trading weeks as visible in this D1 chart. This currency pair has now formed a falling wedge formation which is a bullish chart pattern. Today’s low also formed a higher low than the previous one which is another bullish sign. We expect this pair to breakout above its current chart formation and attempt a bullish run which may take it above its 50 DMA.
MACD has indicated that momentum has improved along the way and formed a positive divergence which is another bullish sign. We expect a bullish centerline crossover to occur during the breakout rally. RSI is trading in oversold territory and has formed a positive divergence as well. A breakout from oversold territory should further fuel the rally.
We recommend a long position at 87.30 which would be an addition to our two previous long positions which we took on May 30th and June 6th at 97.30 and 94.00 respectively. We also recommend a stop sell order at 86.00 as well as 85.00 in order to hedge this trade with a take profit target of 84.50 for both short positions.
Traders who wish to close this trade at a loss are advised to place their stop loss order at 85.50. We will not use a stop loss order and execute this order as recommended. Place your take profit target for all long positions at 94.00.
Here are the reasons why we call the AUDJPY currency pair higher
- The AUDJPY currency pair has formed a falling wedge formation which is a bullish chart pattern after correcting for several trading weeks
- MACD has shown momentum improved and formed a positive divergence which is a bullish signal
- RSI is trading in oversold territory and has formed as positive divergence as well
- Profit taking in order to realize trading profits after a strong sell-off
- New long positions by institutional swing traders at solid support levels
Open your PaxForex Trading Account and add this currency pair to your forex portfolio.