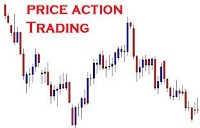
 Price action is encompassed in technical and chart pattern analysis which attempt to find order in the sometimes seemingly random movement of price. Swings (high and low) and tests of resistance and consolidation are some examples of price action. Candlesticks and price bars are important tools for analyzing price action since they help traders visualize price movement. Candlestick patterns, engulfing patterns and crosses are all examples of interpreted price action.
Price action is a form of technical analysis and it uses candles on a chart which represents data. This data shows what the market has been doing for the specified time range. For example if it is a daily candle then it shows what the market did for that day. All economic data and global news that effect price in any way will be reflected on the price chart so it eliminates almost any use of following the news.
The main tool of a price action chart is a candle. A candle is made up of a body, two wicks, a close and an open. The wicks represent the high and the low for the time of that candle. The body is the price movement from the opening price. The body size can differ on candles and depending on whether it moves up or down from its opening price will determine whether it is a bullish or bearish candle.
Support and resistance are extremely important to trading price action. Support zones are areas where the price has fallen to but once it reached the support zone it went back. It acted as a cushion for the price. Resistance zones are areas on the chart where the price has come up to, was rejected and the price was pushed back down. By finding support and resistance you will find “hot zones” as to where you should enter trades.
The price action of a market tends to repeat itself in various patterns. These patterns are also called price action trading strategies and there are many different price action strategies traded in many different ways. These reoccurring price patterns or price action setups reflect changes or continuation in market sentiment. This means by learning to spot price action patterns you can get clues as to where the price of a market will go next.


