The New Zealand Performance of Services Index for February was reported at 52.0. Forex traders can compare this to the New Zealand Performance of Services Index for January, which was reported at 57.2. New Zealand Permanent/Long-Term Migration for January was reported at 6,490. Forex traders can compare this to Permanent/Long-Term Migration for December, which was reported at 5,400. External Migration & Visitors increased by 2.90% monthly. Forex traders can compare this External Migration & Visitors, which decreased by 0.2% monthly.
The US Federal Reserve slashed interest rates to a range between 0.00% and 0.25%, the second time in two week’s the central bank opted for an unscheduled cut. The Reserve Bank of New Zealand cut rates to 0.25% and the Bank of Canada cut rates to 0.75%. Massive quantitative easing programs are being announced in an attempt to stabilize financial markets, but they are unable to combat virus-related economic disruptions. Where are commodities like Silver headed?
Japanese Machine Orders for January increased by 2.9% monthly and decreased by 0.3% annualized. Economists predicted a decrease of 1.0% monthly and 1.1% annualized. Forex traders can compare this to Japanese Machine Orders for December, which decreased by 11.9% monthly and 3.5% annualized. UK Rightmove House Prices for March increased by 1.0% monthly and by 3.5% annualized. Forex traders can compare this to UK Rightmove House Prices for February, which increased by 0.8% monthly and 2.9% annualized.
Chinese New Home Prices for February increased by 0.02% monthly. Forex traders can compare this to Chinese New Home Prices for January, which increased by 0.27% monthly. Chinese Fixed Assets ex Rural for February decreased by 24.5% annualized. Economists predicted an increase of 2.8% annualized. Forex traders can compare this to Chinese Fixed Assets ex Rural for January, which increased by 5.4% annualized. Chinese Property Investment for February decreased by 16.3% annualized. Forex traders can compare this to Chinese Property Investment for January, which increased by 9.9% annualized.
The Chinese Surveyed Jobless Rate for February was reported at 6.2%. Forex traders can compare this to the Chinese Surveyed Jobless Rate for January, which was reported at 5.2%. Chinese Retail Sales for February decreased by 20.5% annualized. Economists predicted a decrease of 4.0% annualized. Forex traders can compare this to Chinese Retail Sales for January, which increased by 8.0% annualized. Chinese Industrial Production for February decreased by 13.5% annualized. Economists predicted a decrease of 3.0% annualized. Forex traders can compare this to Chinese Industrial Production for January, which increased by 5.7% annualized.
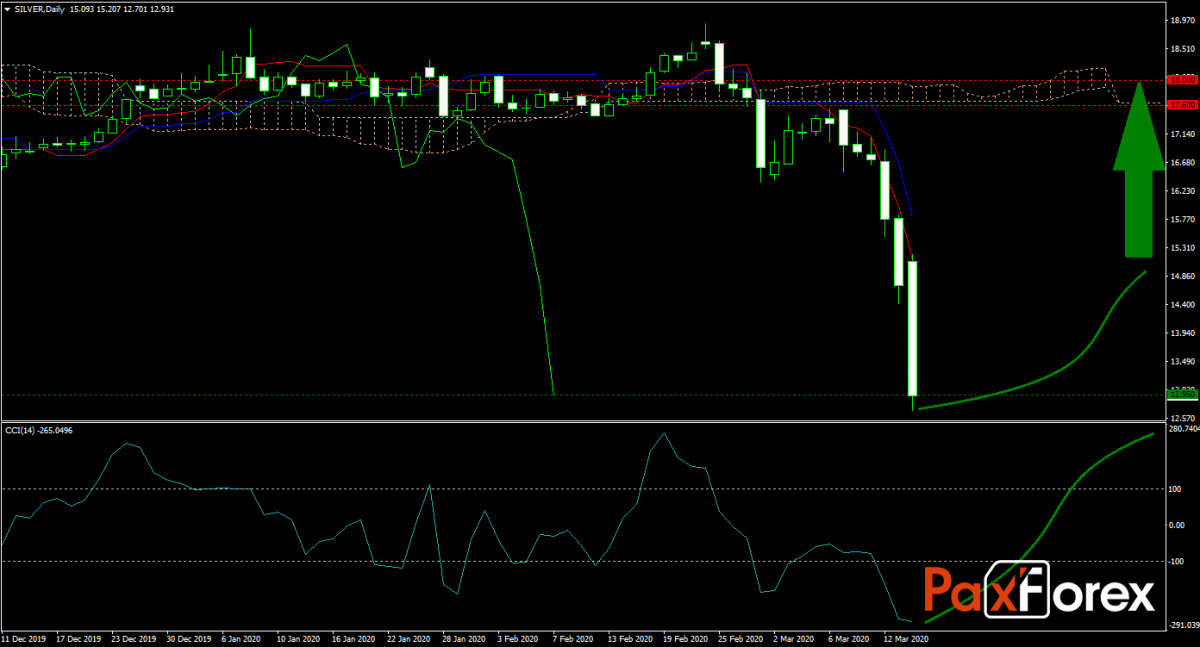
The US Empire Manufacturing Index for March is predicted at 5.0. Forex traders can compare this to the US Empire Manufacturing Index for February, which was reported at 12.9. Canadian Existing Home Sales for February are predicted to increase by 0.5% monthly. Forex traders can compare this to Canadian Existing Home Sales for January, which decreased by 2.9% monthly. The XAG/USD forecast has turned bullish after a steep sell-off with central bank action providing a catalyst. Subscribe to the PaxForex Daily Fundamental Analysis and earn over 5,000 pips per month.

Should price action for Silver remain inside the or breakout above the 12.700 to 13.200 zone the following trade set-up is recommended:
- Timeframe: D1
- Recommendation: Long Position
- Entry Level: Long Position @ 12.950
- Take Profit Zone: 17.600 – 18.000
- Stop Loss Level: 12.200
Should price action for Silver breakdown below 12.200 the following trade set-up is recommended:
- Timeframe: D1
- Recommendation: Short Position
- Entry Level: Short Position @ 11.850
- Take Profit Zone: 11.000 – 11.350
- Stop Loss Level: 12.200
Open your PaxForex Trading Account now and add this currency pair to your forex portfolio.


