Source: PaxForex Premium Analytics Portal, Fundamental Insight
The Singapore Trade Balance for October was reported at $4.360B. Forex traders can compare this to the Singapore Balance for September, reported at $3.100B. Non-Oil Exports for October decreased by 5.3% monthly and by 3.1% annualized. Economists predicted an increase of 4.6% and 5.7%. Forex traders can compare this to Non-Oil Exports for September, which decreased by 11.4% monthly, and which increased by 5.8% annualized.
US Advanced Retail Sales for October are predicted to increase by 0.5% monthly, and Retail Sales Less Autos are predicted to increase by 0.6% monthly. Forex traders can compare this to US Advanced Retail Sales for September, which increased by 1.9% monthly, and to Retail Sales Less Autos, which increased by 1.5% monthly. Retail Sales Control Group for October is predicted to increase by 0.5%. Forex traders can compare this to Retail Sales Control Group for September, which increased by 1.4%.
The US Import Price Index for October is predicted to increase by 0.2% monthly, and the US Export Price Index is predicted to increase by 0.3% monthly. Forex traders can compare this to the US Import Price Index for September, which increased by 0.3% monthly, and to the US Export Price Index, which increased by 0.6% monthly. US Industrial Production for October is predicted to increase by 1.0% monthly, and Manufacturing Production is predicted to increase by 1.0% monthly. Forex traders can compare this to US Industrial Production for September, which decreased by 0.6% monthly, and to Manufacturing Production, which decreased by 0.3% monthly. Capacity Utilization for October is predicted at 72.3%. Forex traders can compare this to Capacity Utilization for September, reported at 71.5%.
US Business Inventories for September is predicted to increase by 0.6% monthly. Forex traders can compare this to US Business Inventories for August, which increased by 0.3% monthly. The US NAHB Housing Market Index for November is predicted at 85. Forex traders can compare this to the US NAHB Housing Market Index for October, reported at 85.
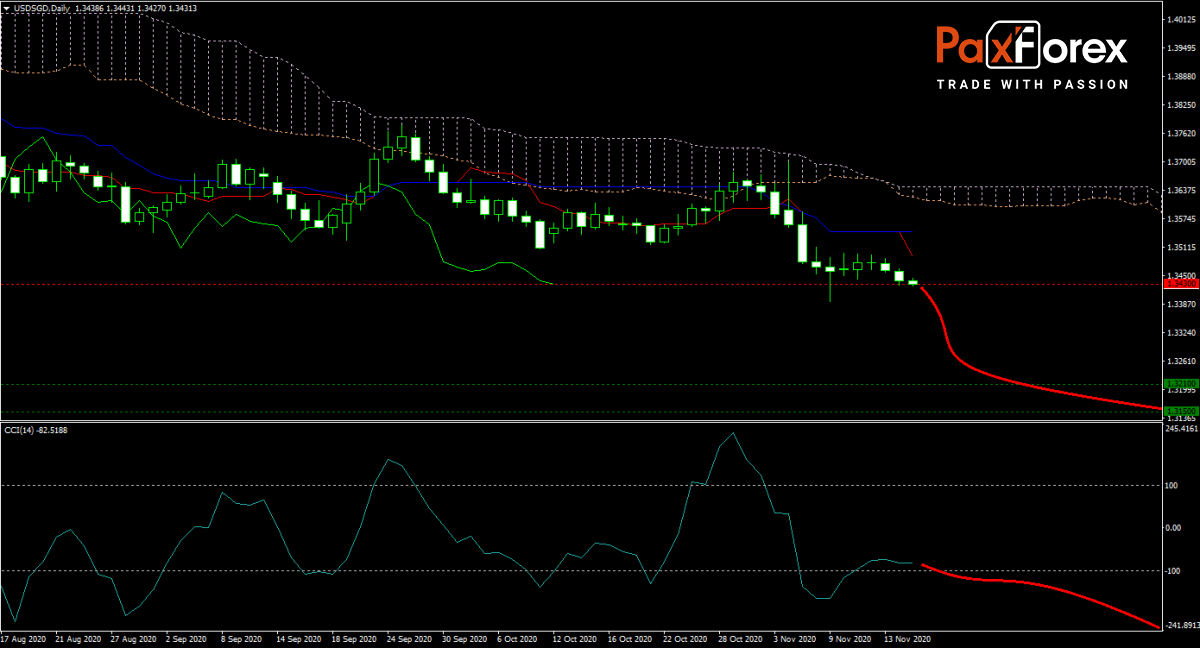
The forecast for the USD/SGD remains bearish, with the outlook for the Singapore economy more positive than that for the US. With the Ichimoku Kinko Hyo Cloud sloping downward, price action is likely to feel increased selling pressure. The Tenkan-sen detached from the Kijun-sen, pointing towards a rise in bearishness, while the CCI has further room to correct to the downside. Will bears force the USD/SGD into its next horizontal support area? Subscribe to the PaxForex Daily Fundamental Analysis and earn over 5,000 pips per month.

Should price action for the USD/SGD remain inside the or breakdown below the 1.3395 to 1.3455 zone the following trade set-up is recommended:
- Timeframe: D1
- Recommendation: Short Position
- Entry Level: Short Position @ 1.3430
- Take Profit Zone: 1.3150 – 1.3210
- Stop Loss Level: 1.3480
Should price action for the USD/SGD breakout above 1.3455 the following trade set-up is recommended:
- Timeframe: D1
- Recommendation: Long Position
- Entry Level: Long Position @ 1.3480
- Take Profit Zone: 1.3530– 1.3545
- Stop Loss Level: 1.3455
Open your PaxForex Trading Account now and add this currency pair to your forex portfolio.


