


Source: PaxForex Premium Analytics Portal, Fundamental Insight
A bear market rally across financial assets saw cryptocurrencies recover, but bearish pressures remain intact, and traders should brace for fresh 2022 and multi-year lows. The D1 chart on Ethereum shows an inverse flag formation, a bearish continuation pattern, which could result in a 40%+ downside from current levels. With equity markets in a bear market, margin calls may result in the forced selling of non-essential assets. Cryptocurrencies occupy the number one spot except in pure cryptocurrency portfolios, where ripple effects of cash requirements can force selling, fueling the downward spiral.
Most equity markets except the NASDAQ100 have not entered the official bear market territory, defined by a 20% drop from their peaks. The cryptocurrency sector has been in one for over six months, leading all financial assets lower. It is the latest sign that cryptocurrencies remain a fringe financial instrument. Institutional demand rose as equity markets enjoyed the artificial bull market created by central banks following the 2008 global financial crisis, which many insiders credit with the birth of cryptocurrencies.
Rising inflation, slowing economic growth, and rising interest rates will feed recession fears and lead to years of stagflation. They form a toxic combination for risky assets, where cryptocurrencies take the lead. First-generation projects like Ethereum face the most risk as developers plug holes and fix issues that third-generation competitors already addressed. Ethereum leads decentralized finance, shocked by the collapse of Luna, which supports the algorithmic stablecoin terraUSD or UST. It led to a brief move below $1.00 in Tether, and while it recovered, the confidence and concerns are here to stay, for now. The ETH/USD faces significant downside pressures, and traders should sell the rallies while long-term investors may want to remain patiently on the sidelines.
The forecast for the ETH/USD remains bearish after this cryptocurrency bounced off support and completed a bear market rally which saw it reclaim the 2,000 level. Confirming the lack of bullish momentum are the flat Kijun-sen and Tenkan-sen. The Ichimoku Kinko Hyo Cloud adds to downside pressure as the Senkou Span A closes in on the flat Senkou Span B with a bearish crossover likely to accelerate the sell-off. Traders should remain cautious as volatility could spike with the CCI moving out of extreme oversold territory, with its push above -100. A reversal in this technical indicator may follow, giving traders their final sell signal. Can bears pressure the ETH/USD into its next horizontal support area?Subscribe to the PaxForex Daily Fundamental Analysis and earn over 5,000 pips per month.
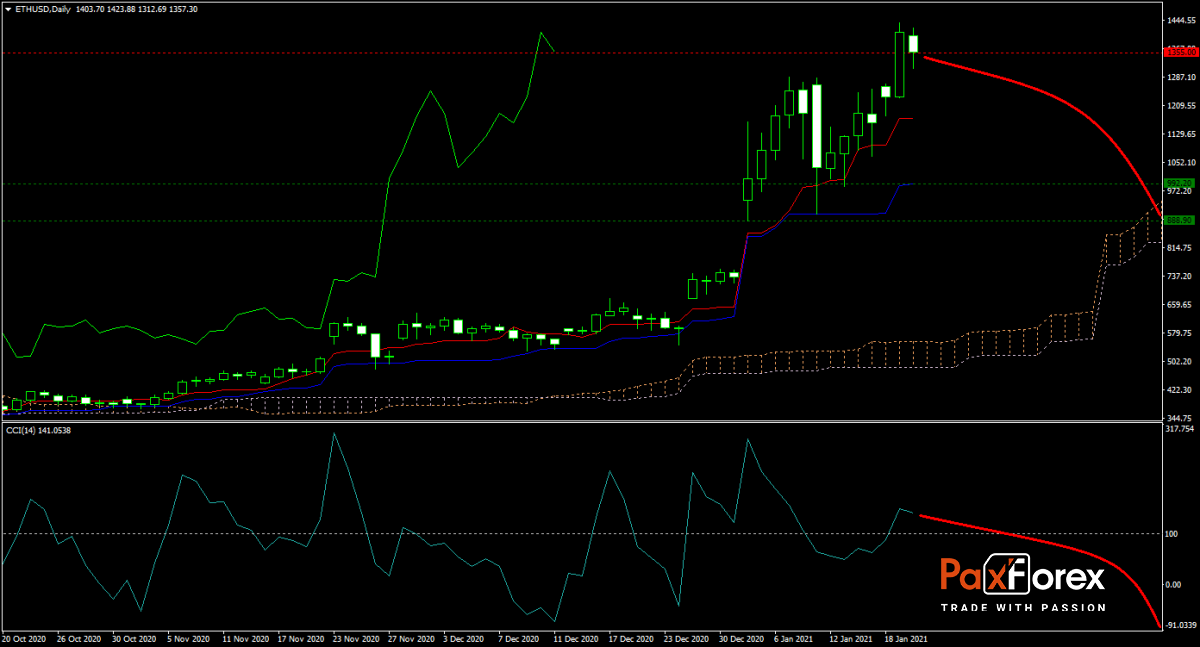
Should price action for the ETH/USD remain inside the or breakdown below the 1,860 to 2,195 zone, PaxForex recommends the following trade set-up:
- Timeframe: D1
- Recommendation: Short Position
- Entry Level: Short Position @ 2,075
- Take Profit Zone: 1.170 – 1.3555
- Stop Loss Level: 2,500
Should price action for the ETH/USD breakout above 2,195, PaxForex recommends the following trade set-up:
- Timeframe: D1
- Recommendation: Long Position
- Entry Level: Long Position @ 2,500
- Take Profit Zone: 3,890 – 4,135
- Stop Loss Level: 2,195
Open your PaxForex Trading Account now and add this currency pair to your forex portfolio.


