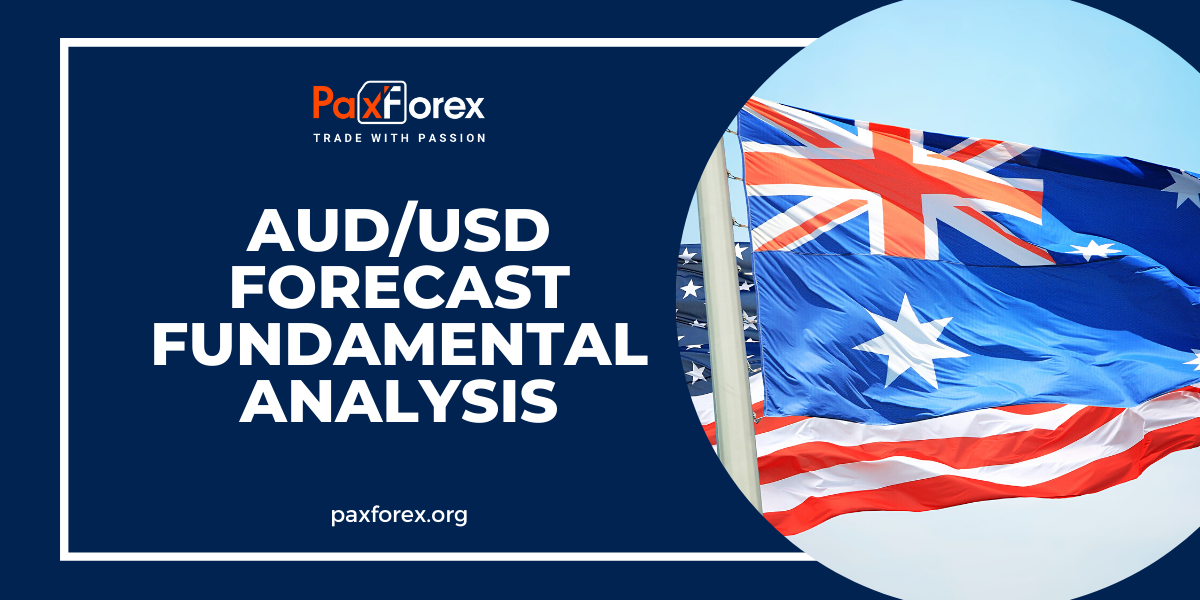
Source: PaxForex Premium Analytics Portal, Fundamental Insight
The Australian AiG Services Index for August came in at 53.3. Forex traders can compare this to the Australian AiG Services Index for July, reported at 51.7.
The Australian GDP for the second quarter expanded 0.9% quarterly and 3.6% annualized. Economists predicted an increase of 1.0% and 3.5% annualized. Forex traders can compare this to the Australian GDP for the first quarter, which rose 0.7% quarterly and 3.3% annualized. Capital Expenditure for the second quarter rose 0.2% quarterly, the Chain Price Index surged 4.3% quarterly, and Final Consumption expanded 1.3% quarterly. Forex traders can compare this to Capital Expenditure for the first quarter, which increased 0.7% quarterly, the Chain Price Index, which rose 4.9% quarterly, and Final Consumption, which expanded by 2.3% quarterly.
The Chinese Trade Balance for August came in at $79.39B. Economists predicted a figure of $92.70B. Forex traders can compare this to the Chinese Trade Balance for July, reported at $101.26B. Exports for August increased by 7.1% annualized and Imports by 0.3% annualized. Economists predicted a rise of 12.8% and 1.1%. Forex traders can compare this to Exports for July, which rose 18.0% annualized, and Imports, which expanded 2.3% annualized.
The US Trade Balance for July is predicted at -$70.30B. Forex traders can compare this to the US Trade Balance for June, reported at -$79.60B.
Traders buying the US Dollar amid fears or hopes for higher interest rates are chasing an old story. While it explained the aggressive advance in the greenback, it has played out. The US Federal Reserve will raise rates to between 4.00% and 4.50% and keep them there throughout 2023. Other central banks began a similar process, and traders should consider the pending US recession and the likelihood of stagflation. Many focus on better-than-expected data, like yesterday’s ISM Non-Manufacturing Index but ignore contradicting reports showing the worst reading for the services sectors in two decades. Chasing the US Dollar higher based on old news became a dangerous gamble, and the Australian Dollar has plenty of upside against the US currency.
The forecast for the AUD/USD turned bullish after this currency pair corrected into its horizontal support area, and a double bottom formation emerged. Volatility could surge as the Ichimoku Kinko Hyo remains flat while the Tenkan-sen and the Kijun-sen continue moving lower. Traders should monitor the CCI in extreme oversold territory. A sustained breakout above -100 could trigger a short-covering rally. Can bulls overcome bears and push the AUD/USD into its horizontal resistance area? Subscribe to the PaxForex Daily Fundamental Analysis and earn over 5,000 pips per month.
Should price action for the AUD/USD remain inside the or breakout above the 0.6680 to 0.6730 zone, PaxForex recommends the following trade set-up:
- Timeframe: D1
- Recommendation: Long Position
- Entry Level: Long Position @ 0.6710
- Take Profit Zone: 0.6930 – 0.6980
- Stop Loss Level: 0.6645
Should price action for the AUD/USD breakdown below 0.6680, PaxForex the following trade set-up:
- Timeframe: D1
- Recommendation: Short Position
- Entry Level: Short Position @ 0.6645
- Take Profit Zone: 0.6500 – 0.6575
- Stop Loss Level: 0.6680
Open your PaxForex Trading Account now and add this currency pair to your forex portfolio.


