The main task of a trader in the process of trading is to correctly forecast the trend. To do this, you need a good understanding of macro and microeconomics, knowledge of banking at a high level, and a clear understanding of the nature of finance.
Moreover, many skills cannot be acquired except through personal experience. Therefore, it is hard enough for beginners to start. But do not be in a hurry to get upset, because there is a way out. We have prepared an overview of specialized programs that can conduct complex analytics for you.
Such Forex prediction software has good enough performance indicators, 83%-92% of forecasts come true. And it means that the overwhelming majority of your trades will be profitable. Shall we get started?
What is Forex Forecasting Software?
Let's begin with the fact that forecasting with the application of programs is reduced to the analysis of historical data by using various mathematical algorithms and economic laws.
So, Forex forecasting software is one of the tools used by Forex traders to simplify the process of analyzing the market with the help of charts and different indicators. Such programs provide access to all the price`s changes for a particular time frame in the form of a chart, allowing traders to analyze the past behavior of this or that asset. Apart from charts, indicators are also of great help, including MAs that help analysts to spot the best time to enter the market as profitable as it can be, as well as the most suitable time to close the position.
Most technicians (Forex traders who prefer to apply technical analysis while analyzing the market) use Forex charting software to forecast the likely fluctuations of rates in the market. There is a broad variety of Forex charting software accessible which is applied for determining the asset`s prices, and all of them differ principally in form and performance. The preponderance of Forex brokers allows you to create a virtual trading account before funding the real one, in such a way you will be able to explore and test various kinds of software, to understand which stock market forecasting software better meets your preferences and trading style.
Such a way is reliable enough and works well on low and medium time frames where the influence of fundamental factors is not so appreciable.
Application of specialized software for Forex trading is appropriate for the following reasons:
time-saving;
ability to work with several financial instruments at once;
high forecasting accuracy;
ease of use;
availability of indicators and signals that automate trading;
risk reduction.
At the same time, it should be understood that the situation in the financial assets market is constantly changing. There are hundreds of economic scenarios and modern realities such that every month new economic and trading models emerge.
This results in programs becoming outdated and yielding less accurate results. Therefore, it is recommended to check them on a demo account before starting trading. This way you can see the effectiveness of the Forex prediction software without risking your capital.
Is it possible to do without using trend Forex prediction software? Yes, you can, but this way you risk even more. You should not learn from your mistakes.
MetaTrader 4 Forecasting Software

A good trader understands that trading on the currency market, relying only on intuition and independently trying to find accurate market entries, is inefficient and will not bring a stable profit. Especially at the very beginning of a trader's career or exploring a new market.
Forex Indicator is a special program that works based on mathematical algorithms and helps a trader to read a chart more effectively, monitor the situation in the market, and make decisions regarding the placement of orders. Thanks to the indicators, traders can more accurately anticipate future price movements, better analyze current movements.
What traders used to do for hours and manually, now can automatically be calculated as a good indicator, properly configured and suitable for the trader by trading style, conditions, currency pair, etc.
The indicator is considered to be an auxiliary tool, which can greatly facilitate the trader to perform technical analysis. Many trading strategies, systems, robots are made based on indicators.
Many indicators are already pre-installed in the most popular trading terminals - for example, MetaTrader 4 offers a wide range of standard tools.
Basic types of Forex indicators:
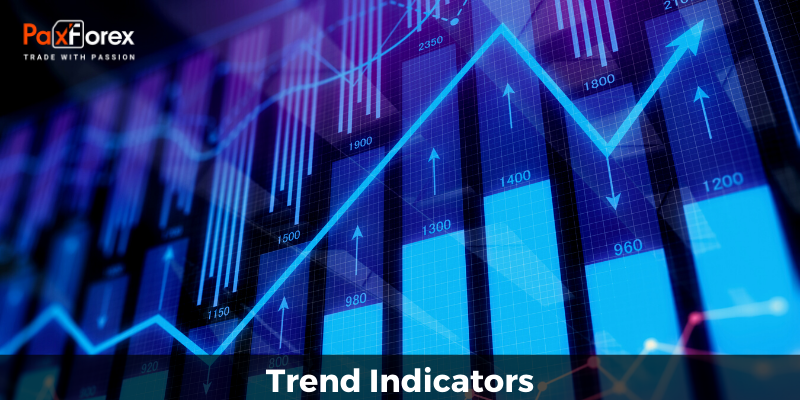
Trend Indicators - confirm/reject current market trends, focusing on divergences in charts, and performing effective forecasts.
Oscillators (Forex inertial indicators) - the most popular, are simplified, measure the size and speed of price fluctuations, perform analysis of price behavior.
Psychological - study market sentiment, make predictions actions of traders.
Signal - indicators that provide information about the market situation in the form of ready-made signals (hints to certain actions in the form of arrows).
Volume - measures trading volumes.
Hybrid - implies a combination of at least two instruments included in the standard set of the trading terminal.
Custom Indicators - those that traders create and place in the open-access network (for free or for a certain amount).
Oscillators
In technical analysis, Forex oscillators are indicators of the speed of price movement for a specific period of time. They belong to the leading indicator that can move around the zero line in the interval from 0 to 100%. During those time intervals when the price is stable, it either moves only within the channel or is briefly suspended to reverse. The oscillator in the Forex market is designed to find points, after which the price will move either along the trend or towards the back border of the channel.
Oscillators are popular indicators among traders, including in the currency market. Their main attraction is the ease of identification of signals for opening a trade, which gives these price filters.
There is a large number of different oscillators, including:
Stochastic
This oscillator is built in a separate window and represents two %K and %D curves. The indicator values range from 0 to 100 percent. Two additional levels (overbought and oversold) are built for this indicator. Their location can be adjusted. The default settings are often 20 and 80 or 30 and 70.
As for the signal types of this indicator, traders use the intersection of lines with each other, the exit from the overbought and oversold area, the divergence of Stochastic and price. For example, when the curves intersect at the bottom, a buy signal is received, if they intersect at the top and reverse down, a sell signal is received. Exit from the overbought area also indicates the beginning of a downtrend.
On the whole, it is a very simple and clear indicator, which is why it is chosen by both beginners and professionals. But before you start working with it, it is still necessary to understand its principles.
- Relative Strength Index (RSI)
This indicator is based on the calculation of closing prices, the number of "positive" and "negative" closings. This indicator was developed back in 1978. Naturally, having reached our days, it is popular among traders.
The main signal type is the exit from the overbought and oversold areas. In this case, it is preferable to use RSI, rather than Stochastic, which is more complicated in perception (Relative Strength Index has only one curve).
Another type of signal is the divergence of the indicator curve and price. This signal does not appear so often, but it is quite strong. So, if you have found it, you can try to open trades.
Another type of signal is a breakthrough of the trend on the indicator. Usually, it happens before the main trend changes in the price chart. Therefore, this signal can also be considered as quite strong.
Trend Indicators

Perhaps, trend indicators can be called the main ones, because classical trading involves spotting trends.
In principle, trend indicators are doing their job perfectly, if not for one "but". The fact is that they are lagging and show a trend in their development.
Most trend indicators are built in the same window as the price chart. They are presented in the form of curves, which are either below or above the price chart. Here are the most popular(and helpful, actually) trend indicators:
Bollinger Bands is an effective trend indicator invented by financial analyst John Bollinger more than 30 years ago. It is still one of the best indicators for forex trading among different methods of determining the volatility channel.
The algorithm laid down in the Bollinger Bands indicator has been selected in such a way that at standard parameters the price stays within the bands for about 95% of the time. Thus, the Bollinger Bands draw the price channel well, which allows us to determine the exact turning points in it. But when catching reversals, the trader should be careful: the price can continue the selected movement for a long time. Therefore, you should protect yourself with a Stop Loss.
Exponential Moving Average (EMA)
The "Moving Average" is the general name of the group of functions, the values of which in all points are equal to the average value of the initial function, taken for the previous period. Usually, this type of instrument is used to smooth out short-term price fluctuations and highlight major trends (cycles, trends). It is especially important in volatile markets.
Exponential Moving Average allows you to reduce lags by giving more weight to the last price values as compared to the prices of the farther ones. In this way, it is possible to react more effectively to all current price changes (compared to the standard moving average). The weight that is given to the last price value directly depends on the period of the moving average: the smaller it is, the greater is the weight of the last price.
So, for example, the 10-period EMA price gives weight 18.18%, 20-period price gives weight 9.25%.
It can be determined by two methods - as a percentage moving average or periodical. In percentage MA the only parameter is the percentage (weight), in the period - period.
In the calculation of EMA, all price indicators for the construction period are used, but over time the influence of old prices decreases and disappears. For shorter EMAs old prices go faster. In real charts, the difference between MA and EMA is not too big, but there is.
Exponential Moving more accurately displays market prices but tends to react very strongly to changes in value. Traders often use it for short-term trading to capture the price instantly. Here the choice is always between sensitivity and the desire to reduce the number of false signals. The more sensitive the indicator is, the less accurate signals it gives.
Forex Moving Average Convergence Divergence (MACD) shows the convergence and divergence of moving averages. It is plotted as a difference between two MAs displayed as vertical strokes. The signal line is the moving average of the MACD line itself. The indicator is used for trend strength analysis.
This indicator is usually used to confirm signals: when MACD dashes are above the zero line, the trend is ascending, if below - descending. The confirmation buy signal is relevant at the moment when the MACD bar chart is above zero line, the sell signal - the bar chart should be below zero line.
Convergence/Divergence can be considered an additional signal. A signal appears at the moment when new, higher highs are formed by the price and the indicator dashes are located at a lower height compared to the previous top. The bullish trend starts to weaken and the price may fall. The same rule works in the opposite direction
General Opinion
Baring in mind that the Forex market is constantly moving, forecasting the next steps can be quiet a challenge. That is why finding a real working Forex forecasting software is to help with that, easing the process of analyzing the charts and improving your trading experience.
We should mention that a lot of traders lose their entire deposits not being able to find the proper software for forex trading and consequently, just open random trades.
Define yourself what you expect from the software and you need to check how to use it. One more important point to take into account while looking for a stock market forecasting software is where to get it. Finding just whatever software is not a problem - there are hundreds of search results with 90% of them saying "stock market forecasting software for FREE". Obviously, you should not expect much from such programs since usually if you pay nothing you get nothing.
Another difficulty finding the Forex forecasting software is an abundance of advertisements promising super-precise software with 10 out of 10 winning rates. So, remember, whenever and wherever you see/hear something like that - stay away, it`s most likely a scam. The point here is that there is no software at all or it`s a phony used by the marketing 3rd parties. When you try to get the software promised you are told to create an account with a particular broker and later will find out that there is no software at all.
To find the best Forex forecasting software and not to get into scam or marketing "trap", here are some recommendations to follow:
The number one thing to check is the version of the software, i.e. see if it`s up to date. Let`s say you have chosen the one that seems to meet all your needs and preferences but it appears that it was created in 2016 and has not been updated after that. Of course, such software cannot work properly and give accurate predictions. It`s like installing the first version of Android on Samsung S20.
The next feature to consider is the tools you can have access to constantly, like MACD, MA, RSI, and Stochastic. Moreover, check if this very forecasting software has reviews of those who have already used it, pay attention to the functionality described, and if any of the customers trade successfully with those predictions.
Before getting any software, see if you like the interface and it is easy to work with such load of information coming constantly. Make sure to open a demo account to test the software and see if all the features needed are working properly.
Last, but not least, the aspect to consider is if this very Forex prediction software fits your personality and your trading style. This one is crucially important since no matter how good the software is, you won`t enjoy it if you don`t feel comfortable using that.
Conclusion
The use of Forex prediction software is convenient but does not give a full guarantee that each of your trades will be successful.
The software is designed to make the trading process easier for the trader but the decision is always made by a person, so before opening or closing an order you should consider not only mathematical data but also the objective situation in the market.


