
In recent years, technical analysis on Forex has gained popularity not only for its relative simplicity but also for its universal approach. This means that it can be applied to all market segments and to different time frames. Many modern trading systems of large financial funds and commercial firms are based on technical analysis. Therefore, both professionals and beginners can use it as a starting point in their trading. In this article we will learn the basics of the technical analysis, will discover how charts can be analyzed, as well as will quickly go through the history and the main stages of the development of technical analysis.
What is Technical Analysis?
Technical analysis is the analysis of price changes by charts to determine the direction of price movement in the future. It is based on 3 sources of information: prices, trading volumes, and time. Unlike the fundamental analysis, there is no information about the reasons for price behavior. It already takes into account the price movement in one direction or another and, based on certain identified patterns in the past, allows us to spot the occurrence of certain events, namely the rise or fall of prices in the future.
Using graphical patterns, trading volumes, participants' activity, and other points, a technical analyst tries to identify stable trends, find real resistance and support levels, as well as possible points of a market trend reversal.
The Origins of Technical Analysis
The technical analysis appeared almost immediately with the beginning of trading on the stock market. At all times, people have sought to buy cheaper and sell more expensive, and have been looking for the right time to do so, trying to analyze the dynamics of price changes.
The earliest mention of technical analysis dates back to the end of the 19th century when Charles Dow himself published an article in the Wall Street Journal in which he outlined several principles with which he believed it was possible to enter into buying and selling deals with minimum risk. These principles were later incorporated into the theory of determining the direction of the stock market. At this point, the talk of technical analysis has subsided.
There would be no happiness but misfortune helped: in 1929 the Great Depression broke out, which, strangely enough, opened new horizons for "technicians". That decade was marked by the publications of such legendary stockbrokers as Elliott, Wyckoff, Gunn, and many others. However, there was no single vector of development: at that time some considered charts as a graphic record of exchange supply and demand, while others were searching for "secret order" at the exchange. The results of the research were the Elliott Wave Theory and the works of William Gunn, who created a complex combination of geometric-algebraic principles, which traders successfully used in derivatives markets. With the advent of computers in the '70s, technical analysis began to take a more mathematical form: analytical methods began to develop with great speed using mathematical approximation and filtering. This included the creation of Widler's Guidance System, which allowed trends to be detected and determined by their speed, and a huge number of indicators.
Currently, technical analysis is an alloy of indicators with such classical tools as price levels (support/resistance, Fibonacci, etc.), patterns, trend lines. Although, it should be noted that there is also such a direction of modern technical analysis as Price Action, which rejects the use of indicators and is fully based on the visual analysis of price charts (which, in a certain sense, is nothing but a return to the roots).
Does Technical Analysis Work?
The effectiveness of technical analysis on Forex market can be explained quite simply. A huge number of traders all over the world using technical analysis see the same charts, models, and figures using the same indicators and oscillators. And as soon as there is a signal that technical analysis interprets as a signal to buy, the majority of traders start to buy. As a result, the price starts to go up. If you need to sell according to the technical analysis, then many people start to sell, which pushes the price to the bottom. And the stronger the signal, the more players enter the game.
There are several hundreds of different indicators in the world, based on which we can derive an assumption about further price movement. And the more people use this or that indicator, the more effective it is. Therefore, over time, the number of traders is smeared by these indicators, which ultimately reduces the effectiveness of each indicator.
Therefore, the most effective is considered the simplest (but strong) models and only a few basic indicators, which are used by most players in the market. The explanation is also quite simple. Most traders learn only the basics of the analysis, which is quite enough for them to trade.
Forex technical analysis is similar to statistics and public opinion polls. Its main purpose is to reveal the crowd's mood or balance of forces and take the side of the majority. In the case of bullish moods to buy, in case of bear ones - to sell. And as soon as the balance of power begins to change, it`s time to exit the market.
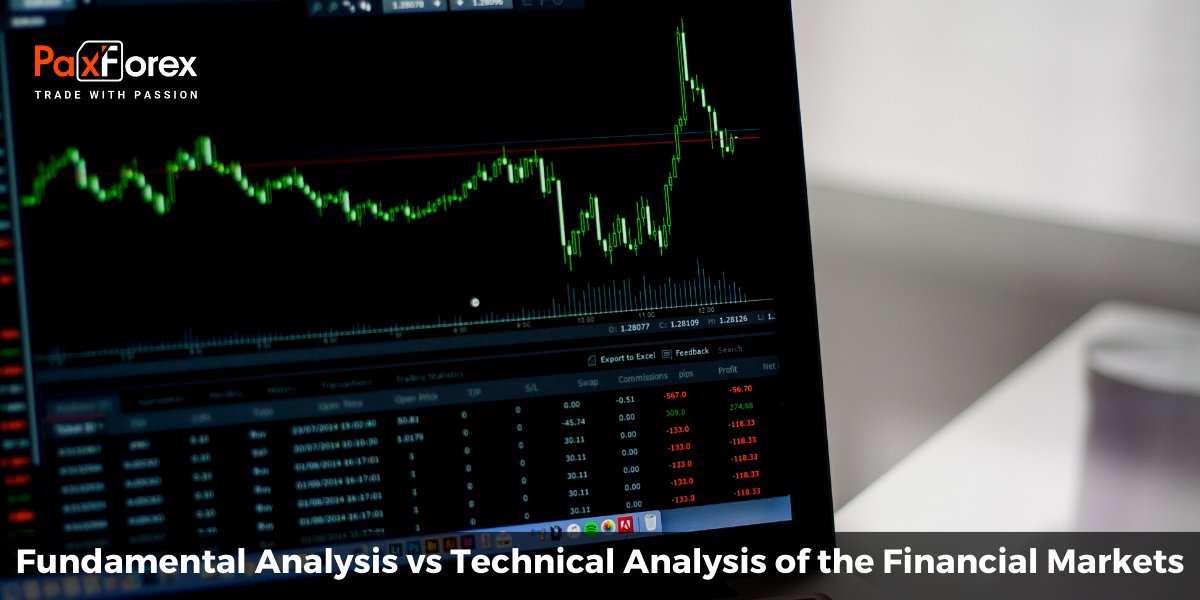
Fundamental Analysis vs Technical Analysis of the Financial Markets
Advantages of Technical Analysis:
Concentration on price. If the task is to predict future prices, then it makes sense to focus on current and past price movements. Often, the reaction and price movement occurs earlier than the fundamental reaction. It is believed that the financial market is the leading economic indicator and that it "leads" the entire economy of the country, ahead of 6-9 months. And to keep up with the market, it makes sense to focus on price. But we should not forget that the changes in the market are very insidious. And although the market can present sharp indirect surprises, as a rule, you can recognize the signs that predict this or that change. Technicians call an accumulation period, a period that foretells a rise in prices, and a distribution period, a period that foretells a fall in prices.
Demand/supply, and price behavior. Many technical analysts use opening, closing, maximum and minimum prices when analyzing an asset. Each of these four prices has useful information. Separately, they will not tell much about this asset, and together - 4 prices can clearly show the behavior of supply and demand in the market. Thus, operating with these four, we can observe the struggle between supply and demand. Simply speaking, increasing-price means increasing demand and decreasing price means increasing supply.
Support and resistance. Simple Forex technical analysis of charts will allow us to see the support and resistance lines. They can be easily seen by price accumulations in a certain closed imaginary corridor. Such price behavior indicates that supply and demand are at an impasse. As soon as the price goes beyond the aisle of the corridor, it means that either demand or supply has "won" the fight for price. If the price has risen above the upper line of the corridor (resistance), it has won the demand. If the price has fallen below the bottom line (support), the supply has won.
Graphic display of the price. Even if you are a supporter of fundamentalism, an illustration of price history will give you a lot of useful information. The chart is a simple and convenient way to display the price history of an asset. A chart is much more convenient than a table with numbers. Most charts show the trading volume. Thus, with such a convenient picture of the asset history, it becomes very easy to detect the following: price behavior before and after some important event; past and present volatility; the history of trading volumes; asset`s dependence on the market (and vice versa).
Market Entry. Technical analysis on Forex allows choosing a good time to enter the market. Some analysts use fundamental analysis to decide what to buy, and use technical analysis to decide when to buy. It is not a secret that time calculation can significantly affect the yield. Technical analysis will detect demand (support) and supply (resistance) and turning points. Even if you just buy near the support line or after breaking the resistance line, it will significantly increase your profits. It is also important to know the history of the asset. If you thought that the instrument has been growing over the last years, but in reality, it has not, then you can make a big mistake. For example, if the instrument has already shown its maximums, it would be logical to expect a price decrease. Or if the stock falls, it would be logical to wait until it reaches the minimum and turns around.
Disadvantages of Technical Analysis:
Analytical interference. Like fundamental analysis, technical analysis is very subjective and therefore interference is reflected in the analysis results. It is important to keep this in mind when analyzing charts. If, for example, an analyst is a buyer in his life, he will see signs for buying where they may not exist. If the analyst is a seller, the interference will be in the direction of selling.
Doubtful conclusions. Based on the same analysis, you can draw different conclusions. Perhaps, this phenomenon is one of the most serious shortcomings of Forex technical analysis. Even though there are generally accepted standards, often two analysts can see different trends on the same chart and both will find confirmation of their conclusions, and they will have the right logical reasoning.
Too late. Often technical analysis is accused of giving signals too late. By the time the technician discovers and confirms the trend, most of the change will be over and the profit/risk ratio will not be as high.
Advantages of Fundamental Analysis:
Business background. One of the most obvious advantages of fundamental analysis is that fundamental analysis provides a very good understanding of enterprises and business in general. After such a thorough analysis, investors will be able to see through the companies. You will be able to determine what exactly affects the income of a given company, or where it has the weakest link. The experience of fundamental analysis will allow you to identify companies that are likely to go bankrupt shortly, as well as those that are focused on long, hard work and success. Moreover, the experience of a fundamentalist will open up in you the skills to identify the drivers of entire sectors, spheres, and industries.
Valuable discoveries. A good fundamental analysis allows you to discover valuable stocks, i.e. those that have high internal potential and value. Many investors are looking for valuable assets and are willing to wait long enough for them to prove themselves. It is a fundamental analysis that helps find companies with powerful assets, strong balance sheets, stable earnings, and growing profits.
Long-term investments. Fundamental analysis is ideal for long-term investments. It provides an opportunity to predict long-term economic, demographic, technological, and consumer trends with high probability, thus helping investors to find good tools for long-term investment. Considering that Forex technical analysis is not so good for long-term investments, this specificity of fundamental analysis is a serious advantage.
Disadvantages of Fundamental Analysis:
Limited time. Fundamental analysis can trace the internal life of companies, industries, and the market in general, but thorough fundamental analysis takes a very long time.
Special approach. One of the drawbacks of fundamental analysis is the need to be tailored to each company. The methods of fundamental analysis may vary depending on the industry and the unique factors of a particular company. Therefore, each industry and each company requires its unique approach.
Subjectivism. The next drawback of fundamental analysis is the hope for a certain outcome. The fair value of a share is based only on assumptions. Often, fundamentalists are aware of such mistakes and perform analysis in three modes.
Determination of fair price. When the share price reaches a maximum (or minimum), there is a desire in the market to adjust the price or bring the share to its fair price. The fair value of a security is determined by the price you are willing to pay for it.
Technical Analysis Basics

Price action discounts everything
This is a fundamental principle: we understand that the price is formed based on millions of different factors (remember the "butterfly effect"?). But we cannot take into account all these factors, so we assume that these factors have already been taken into account, all of them. The price established in the market is the same indicator with which all the factors have been taken into account. Even without understanding their influence, and without knowing about them, we can see the final effect of their influence, embodied in the form of price fluctuations.
Accordingly, by analyzing price dynamics, we can make assumptions about how this price may behave in the future. It is the technical analysis that tells how to predict the future movements of the chart, not analyzing the underlying causes and motives, but studying only the dynamics of the chart itself.
Price moves in trends
The cornerstone of technical analysis for Forex instruments is an understanding of the trend concept. It is necessary to understand that any trade is first of all an exchange of information between people. This means that human psychology and human nature will play the main role here. People tend to "be in the herd" and strive for fashion. The same is reflected in the market: when the price starts to change, a trend is formed. A kind of corridor where price moves in a certain direction: up or down.
The trend is limited by two horizons: the support line and the resistance line. Support is a psychological level, below which price does not go down, and resistance is a trend ceiling, which price does not breakout. Technical analysis assumes that the market works cyclically:
a trend is formed from the uncertainty;
is moving in it;
there's a growing desire to break the trend;
the trend breaks down, and then there's a new period of uncertainty.
Since our task is to predict the price movement, we are interested in trends, first of all, as indicators of future movements. The sooner we notice the trend, the longer we will be able to make a profit by trading in this trend. Therefore, the key foundations of technical analysis are the methods of early identification of the trend, as well as signs that the market is planning to change this trend.
History repeats itself
One more basic postulate of technical analysis. We have already agreed that all trading is based on human psychology. And since human nature does not change with time, the nature of price dynamics on the market will not change either. Forex technical analysis asserts that market conditions constantly repeat patterns (templates) that have already been encountered before. Certain combinations of price rise and fall are repeated on the charts a thousand times, which suggests that such dynamics are typical for human psychology. Having noticed the signs of the formation of this or that typical trend on the chart, a technical analyst can predict in advance how the market will behave following the existing pattern.
Based on standard templates, technical analysis forms the so-called "figures", which are the most common forms of the chart. For example, there is one of the most famous "head and shoulders" patterns.
The analysis of market regularities and repeating patterns allows us to determine the points to enter the market and predict the upcoming movements.
How To Get Started: Choosing The Best Technical Analysis Software
Today there are many programs, but it is necessary not only to know the best Forex technical analysis platforms but also to sift out the useless ones. Many will agree that the best software is the well-known MetaTrader 4 which is used by most traders around the globe meaning it has proven its effectiveness.
To effectively practice trading, you should open a MetaTrader 4 demo account. Here you can work in the virtual market without risking your investments. It is a very good practice for any beginner.
The program will need a considerable number of indicators for a high-quality market forecast. Thus, MetaTrader 4 has 60 different indicators, with the ability to create additional ones. With their help, you will calculate the volume, the best points of opening and closing a position, determine the trend, and so on.
MetaTrader 4 is the highest quality program for the technical analysis of Forex market. You will not need to buy additional indicators, as they are already built into this platform. As soon as you have installed MT4, you can start the technical analysis immediately.
All newcomers will be interested to start it here, and more professional traders will be able to set up indicators at their discretion. In addition to the indicators, you will be able to determine the orientation of this analysis, so that it fits specifically to your strategy.
How to download the MetaTrader 4 technical analysis software
MetaTrader 4 is known to be a reliable and popular trading platform. Traders all over the world, regardless of their experience in trading, have already appreciated the convenience and profitability of MetaTrader 4.
With its maximum functionality, the platform allows you to execute trades, monitor quotes of selected assets, carry out technical and fundamental market analysis, apply the most profitable trading strategies and create new ones, as well as copy successful transactions of other traders.
How to download MetaTrader 4:
Download the trading terminal - it is better to do it from the broker`s website and then install it in the standard order. If necessary, we set the settings Service - Settings. In the window appeared you should specify the server parameters, as well as account number and password.
Technical Analysis Charts
In technical analysis for Forex trades, the chart is a fundamental element. Charts represent a display of price changes over a certain period of time.
The most popular charts among traders are Japanese candlestick charts, line charts, as well as a bar chart.
Technical Analysis Line Charts
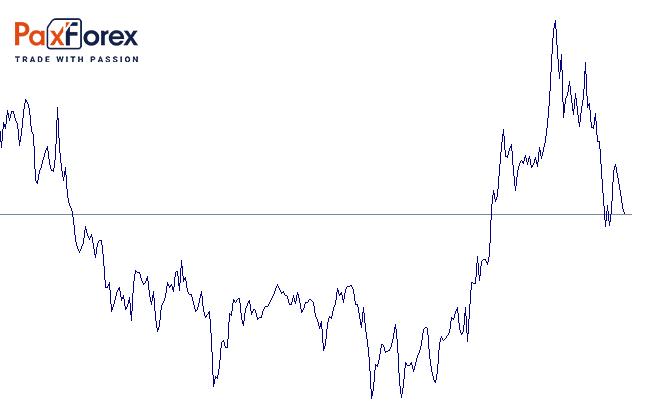
A line chart is a straight line that connects closing prices. Many traders believe that the most important for the analysis is the market closing prices. For this reason, it is possible to use line charts, although, it significantly narrows down the analytical capabilities.
Generally speaking, closing prices are among the most important, but only for daily, weekly, monthly, etc. charts. This is mainly since the value of investment portfolios and simply open positions are determined by the closing prices. However, if you analyze the quotes of the Forex market or other round-the-clock markets (for example, futures on S&P500), the concept of "daily closing" dissolves into geographical scope. The closing of Japanese, European, and American markets will be quite different.
Technical Analysis Charts OHLC (Bar Chart)
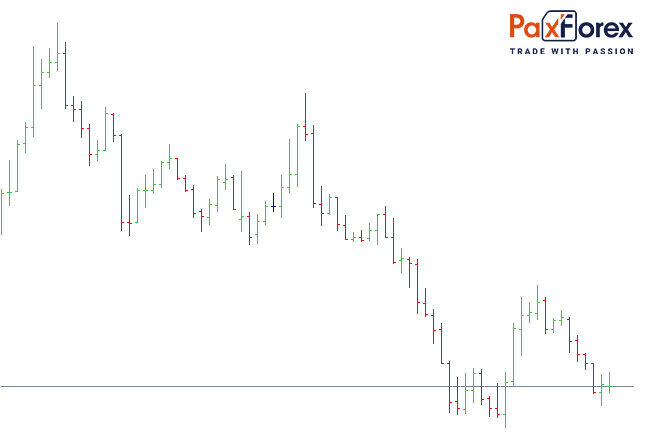
Most traders and analysts use bar charts, which, unlike the line charts, much more fully reflect what happened to the price for the analyzed period of time. The bars include, in addition to closing prices, the maximum and minimum quotes observed over a specific time period.
There are two types of bars. One shows the opening prices, while the other does not. The second type of bar chart is more frequent in use.
They say that the highest price level (high) shows the strength of bulls during the trading period, and the lowest price level (low) shows the strength of bears.
Technical Analysis Candlestick Charts
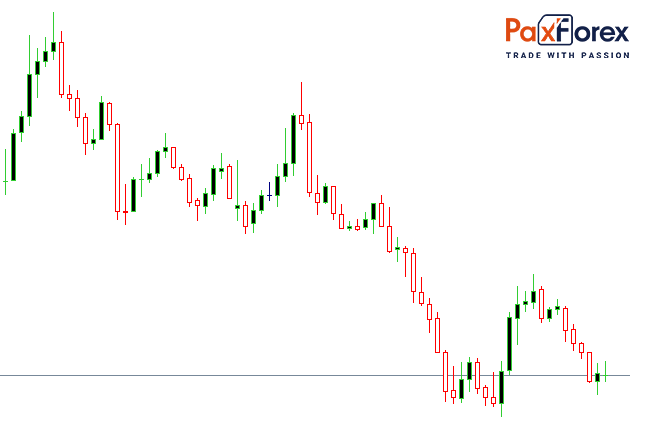
Japanese candlesticks as a kind of display of market information, as well as an independent field of technical analysis, appeared in the 18th century in Japan. Graphically they are very similar to bar charts.
The fundamental difference between Japanese candlesticks and bar charts is the presence of a rectangle formed in the price interval between open and close quotes. This rectangle is called the real body of a candlestick. It can be black or white depending on the ratio of opening and closing prices. If the candlestick body is black, it means that prices have decreased during the trading period (the closing price is lower than the opening price). If the body of a candle is white, then the prices have increased during the trading period (the closing price is higher than the opening price).
The movement of prices above the body of the candle forms the upper shadow, and below the body forms the lower shadow.
This type of chart has turned out to be the most developed over its long history, which allows using it as an independent method of technical analysis of Forex. The most known candlestick combinations that give certain and unambiguous signals will be described a bit later
Technical Analysis Candlestick Patterns
Not all candle patterns work equally well. Their huge popularity has reduced their reliability, also due to hedge funds and their algorithms. After all, they rely on the lightning-fast speed of execution of orders, playing against popular technical settings, common among ordinary traders. However, reliable patterns exist and continue to work, allowing earning both in the long and short-term.
Below we will reveal five patterns that work exceptionally well for determining further price direction or momentum. Each works within the context of the bars around it. They are also time-sensitive. First, candlesticks work within the selected time frame - intraday, day, week, etc. Secondly, their potential decreases rapidly during 3-5 candles after the setup.
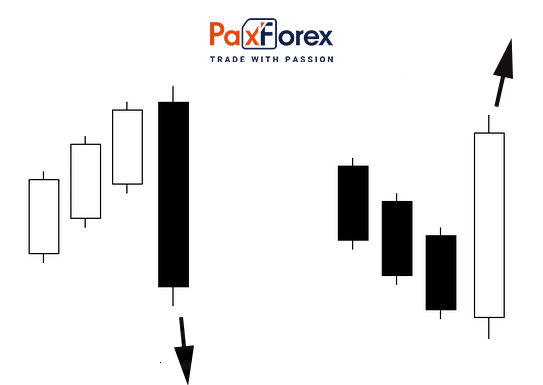
Three line strike - a reversal pattern, looks like three descending candlesticks, with the subsequent candlestick lows lower than the previous one, the price close level is close to the lows within the specified time frame. The fourth candlestick opens below the previous one but completely covers the three descending candlesticks, closing above the first one. According to Bulkowski, this reversal marks a further price increase with 84% accuracy.

Two black gapping is a pattern of the trend continuation. It appears at the bullish trend peak as two-gap candlesticks with lower lows. The consequence is a further decrease in the quotes with a 68% probability.
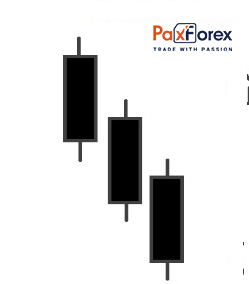
Three black crows is a reversal pattern with a high probability of execution - 78%. “Crows” appear at the peak of the uptrend in the form of three candlesticks descending one after another. The low of each of the candlestick is lower than the low of the preceding candlestick, and the closing price is at the level of the low of the selected time period. This pattern characterizes the downturn in business activity and further price decline. In most cases, a bearish attack starts with a new high and is a kind of trap for buyers who trade at the moment.
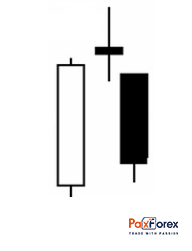
Evening star, a bearish reversal set-up, starts with a long white candle that seems to foreshadow the continuation of the ascending movement. If the next candlestick opens with a gap and there are no new buyers, we get a candle with a narrow range (body). The next black candlestick with a gap down forms an evening star pattern, which promises a continuation of a price decrease. According to Bulkowski, the set-up works in 72 out of 100 cases.
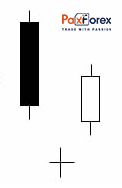
Abandoned child is a bullish reversal pattern that appears at the end of the downtrend, after a series of candlesticks with falling lows. When the price is gaping down, but there is no activity of sellers, the candlestick is formed with a thin body, i.e. the opening and closing prices are the same. A bullish candlestick following such a candlestick completes the pattern formation. Further, an uptrend or a short-term price rise develops. The probability of execution of the pattern is 70%.
Technical Analysis Chart Patterns
Head and shoulders
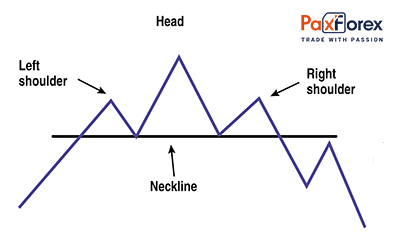
In technical analysis for Forex assets, it is believed that the appearance of this figure precedes the reversal of the market trend. It looks like three tops, of which the side (shoulders) are lower (or higher depending on the past price direction) than the one in the middle (head). The line drawn on local extrema is called the neck. It is the level whose penetration indicates the change of trend.
Double top/double bottom
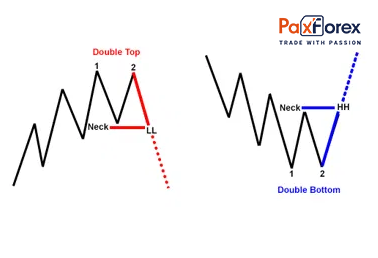
It's a reverse technical analysis tool. It is very easily presented and interpreted on the chart as two consecutive tops in case of ascending movement or two bottoms in case of descending trend. After the formation is completed, it is assumed that the price will go in the opposite direction from the previous trend.
Triangle
Such figures of technical analysis as triangles are found in Forex markets with enviable regularity. In addition to the fact that they differ from the direction of the price, they can also be symmetrical. They are universal, i.e. depending on their type, they can indicate both continuation of the trend and its reversal.

The symmetrical triangle is formed at the intersection of two trend lines, and the direction of the breakout indicates the further expected path of price.
Descending triangle The descending triangle is formed as a crossing of the resistance line and the trend line after a bearish trend.
Ascending triangle. The ascending triangle can be formed after a bullish trend. Its illustration is the junction of the resistance line and trend.
Flag

This technical pattern appears on the market after strong directional price movements: a narrow flat movement is formed towards a correction pullback, the breakthrough of which will signal the continuation of the main trend.
Pennant
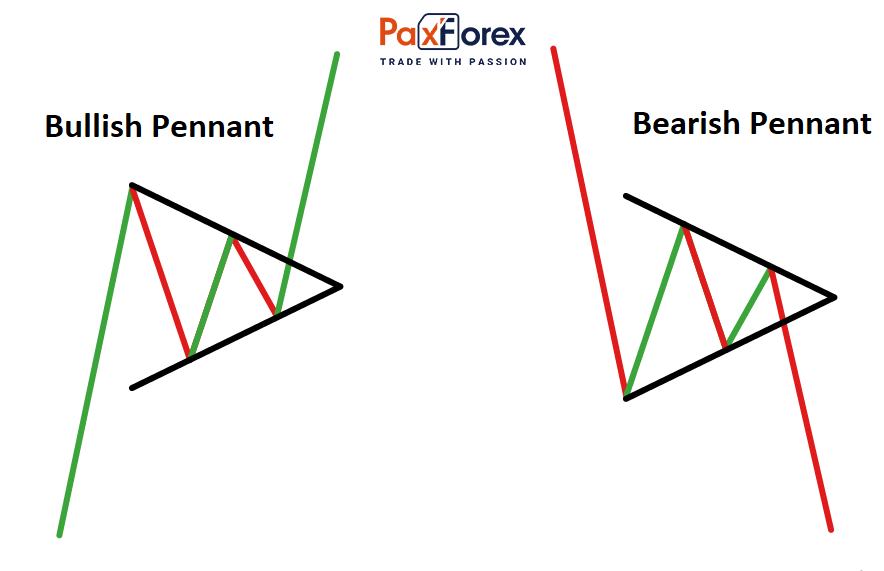
One more trendy technical figure of the market. It is very similar in its structure and characteristics to the flag formation: it also appears after the momentum price movement, but at the moment of correction the range of this figure starts to narrow gradually, and after the breakthrough, the main trend is supposed to continue. It works mirror-like both in one direction and in another.
Wedge
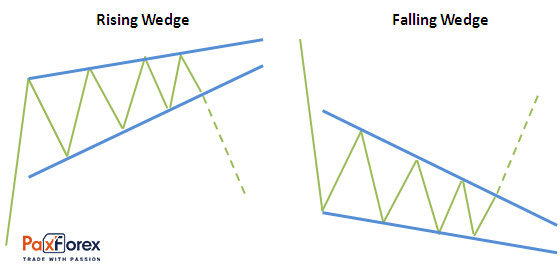
Visually similar to a pennant and flag pattern, but the wedge is a technical analysis tool. On the chart, such a figure is represented as a conical movement towards the main trend with a gradually decreasing range of volatility. Exit from the range to the opposite trend side indicates a change of trend.
Why you should start using technical analysis with PaxForex today!
If you're looking for a reliable broker with the best trading conditions, you`ve got to the right place! Trading with PaxForex you will access the wide range of markets, including currencies, shares, and more. Apart from that, you are liable to the leverage of up to 1:500 and the spread from 0.4 pips. Make the most out technical analysis of Forex with the MetaTrader4 and our daily trading signals.
The security of client funds is ensured by their storage on segregated accounts, separately from the company`s funds. With the 4 types of accounts offered, there is something that will suit your style and financial goals, you can be sure. Open a live account and discover all the beauty of trading with PaxForex.


