What is a fractal?
Recently, the term "Forex fractals" has been tightly accepted by traders. Everyone has been talking about it since 2001 after the publication "Trading Chaos". In this book, the author presented his vision of trading fractal (Charles Doe was the first to introduce this term, but he made it clear to a narrow circle of mathematicians). The availability of explanation and efficiency made it possible for most traders to use them.
Fractals are used in technical analysis to build forecasts of price behavior (rise or fall) in the currency market. In a simpler and clearer form, fractals are geometric shapes, similar to each other, consisting of their copies.
Fractals in the currency market are not fully mathematical figures. Initially, Charles Dow started to use fractals with technical analysis (graphically expressed price behavior figures on the chart are similar to each other).
Fractals are shapes consisting of five or more candlesticks or bars, the average of which has the highest or lowest value (for upward and downward charts respectively). Such shapes appear at any time frames (from five minutes to the D1, and so on). Fractals allow confirming the continuation or reversal of the current trend.
Example #1
Bearish Forex Fractal Set-Up

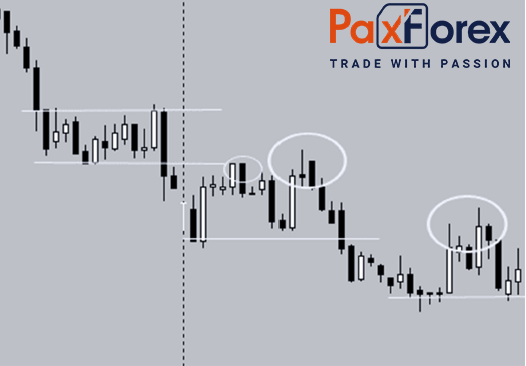
Price action is going lower and three fractals checked by horizontal white lines in the chart to the left which shows each fractal`s support and resistance levels. As shown on the screenshot, the price movement performed a breakdown under its support level (first fractal from the left) and later went almost same amount of pips to the downside as within its first support and resistance level. Right after it finished its movement, the price started to trend sideways as sellers closed the position which enabled price action to uphold. We can check fundamental circumstances that may have committed to the executed move.
Also, the dotted horizontal line signifies the end of a trading session and price action descended through support level because numerous traders usually close their buy orders to bypass holding them overnight. It helps them much since in such a way they avoid negative swaps, plus something can happen and they won`t be able to do anything. Once the new session began, price action fell further as it formed an overlap in trades and the next support level established.
While the price plunges through a support level, this level shifts to resistance and both white circles on the screenshot, the first and the second one, show this switch. Buyers tested the new resistance level and price movement was discarded in both cases. The ones who prefer short-term trading could have placed two short positions each time price action neared its new resistance level, setting Stop Losses just above the level to avoid the consequences of a possible breakout.
Subsequently, the second rejection price action reduced further which produced another breakdown of support level, succeeded by a test of its new resistance level. The third white circle shows one more great possibility to short. The brand-new support level completed approximately within the same pips interval as before, consequently a recurrent pattern or a fractal. This can be replicated until there will be a fundamental shift in the market sentiment.
One more option of how to treat the fractal pattern is that following each breakdown or breakout, the price movement will look for another support/resistance level in a comparable range as previously. Big market participants, including banks, usually pay attention to the support and resistance levels at which point positions course in which can bring a breakout/breakdown. It may breakthrough time frames until a sentiment alteration befalls at which the pattern may be replicated in the other direction.
Example #2
Bullish Forex Fractal Set-Up

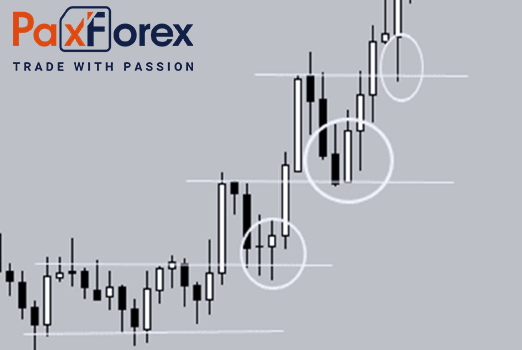
On the second picture, you can see the way support and resistance levels are outlined from fractals is the same notwithstanding the direction. Similar to the previous example, price action breaks out of its resistance, covers a related distance as within its primary support/resistance level and then reels to test its new support. Just like we have mentioned above, the pattern will replicate itself repeatedly until there will be a fundamental change in sentiment, usually, this may be some unexpected announcements or extremely good/bad news. The white circles in the chart show each time price action turned around succeeding a breakout from where long positions could have been opened to catch the move to the upside.
Traders can imply the Forex Fractal Strategy either by making use of a breakout/breakdown or a retest of support/resistance.
The Breakout/Breakdown:
Find a long candlestick that tests a support/resistance level.
- Place a limit order above the support/resistance level setting a Stop Loss below it.
Set a Take Profit at the approximately same range as among the support and resistance levels of the first fractal (ley`s say 30 pips).
The Retest:
Find a breakout/breakdown which will cross the extent of the first fractal support/resistance level (let`s say 20 pips).
- Keep an eye on the price movement not to miss a reversal to the support/resistance level where the breakout/breakdown happened.
Set a limit order above the resistance/support level with a Stop Loss below it.
- Watch price movement for a move above from where a possible breakout/breakdown may happen.
We are one of the fastest growing Forex Brokers in the Market. Trade with PaxForex to get the full Forex Trading experience which is based on...
- The Reliability on all Assets in the Market
- Trusted Worldwide for over a Decade
- Live Multi-Lingual Online Support 24/5


