

What makes a successful trader? Above all, it is the skill to strategize and forecast all possible outcomes. Of course, this doesn’t come at once. Becoming a professional currency trader can take some time, especially if you have your eyes on the prize and don’t mind staying focused on small details that add up into a big picture. The key is the combination of patience and a clear easy to follow plan. As long as you have a comprehensive idea of what you should be doing next, you will get guaranteed positive results. Now, with that said, it is also fair to mention that the learning phase might appear tricky due to a great amount of technicalities. What you should keep in mind, is that the best quality of Forex is its ability to be structured and analyzed. So, basically it is all very possible. For example, let’s break down the steps of Forex candlestick analysis to make a first move towards becoming a true pro.
For starters, let’s figure out what is a candlestick in Forex and where it is used. To oversee the situation at the market and build an effective trading strategy, traders use the data that can be found on the chart. The chart represents mainly the price values of selected currency pairs at different times. There are three ways a market chart can look like: candlesticks, bars and lines. Each of the mentioned options is equally efficient and popular. Today we are going to focus on the candlestick Forex analysis including its specifics and instructions.
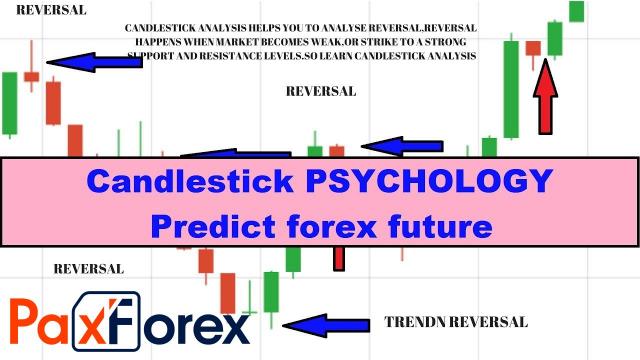
To an inexperienced trader the candlestick chart might seem confusing at first. The color scheme of the chart depends on the trading platform setting, but the main elements will look the same. The name of this type of chart comes directly from the way the units look - vertical rectangular boxes of various heights with small vertical markings at the top and bottom. Kind of like candles. There are two types of candlesticks at the charts: the ones filled with color and the ones that look like just an outline. In some platforms, however, both types will be filled and you can tell them apart by which color is used. On standard charts the filled candle is also called bearish (or bear) and it can appear on the chart when the opening value of the currency is higher than a closing one. The non-filled candlestick is also referred to as bullish (or bull) and shows up when the closing value is above the opening one. Important step to make sure you can read the chart correctly is to distinguish bearish candles from bullish ones.
Every professional trader has their own techniques when it comes to analysis, but the chart reading strategies usually remain the same. Let’s go through a few steps of navigating through chart settings and learning how to read Forex candlestick charts:
We are one of the fastest growing Forex Brokers in the Market. Trade with PaxForex to get the full Forex Trading experience which is based on...
To receive new articles instantly Subscribe to updates.