
On February 3rd, financial markets saw their first spike in volatility in over seven years which rattled the cage of traders and investors across asset classes. Well over $2 trillion were wiped off portfolios in a very short period and while assets have rebounded since then and recovered losses, it opened up discussions about what will be next for financial markets. The preceding period of low volatility was unprecedented and while the majority may have felt comfortable, professionals have warned about the dangers. Complacency to risk became the most dangerous part of trading, but remained ignored.
Over the course of 2017, the US Dollar continued to deteriorate against its G-10 peers and the US Treasury under Secretary Mnuchin drifted away from the previous strong-dollar policies and welcomed a weaker US Dollar. That by itself was not a reason for concern, but when it comes to financial markets everything is connected somewhere and somehow. Fast forward to the February mini-crash and layer US Treasuries over the entire picture and the problem starts to become more visible. From a technical analytical perspective, a very interesting and must-watch scenario is about to play out.
The S&P 500, the most closely watched indicator of US equity market strength, has recovered from the mini-crash and yesterday move above the close it recorded on February 2nd which was the day before the crash occurred. The next few trading sessions will be crucial in order to determine if the advance will continue or if this was a dead-cat-bounce. The US Dollar remains under pressure and last but not least US Treasuries continue marching higher. The 10-Year Yield is on its way to breakout above 3.00%, 14 basis points away from it, with the 30-Year Yield above 3.15%. Some market watchers argue that a 10-Year Yield above 3.00% will start to create a new range of issues while an inverted yield curve, the 10-Year above the 30-Year, may start the next global financial crisis.
Currencies will react sharply, especially the US Dollar, when the 10-Year Yield will move above the 3.00% level with a full blown Bondageddon should there be an inverted yield curve. This will no doubt create wild swings in price action and forex traders stand to reap pips if they are positioned properly. PaxForex offers all forex traders daily fundamental and technical trading analysis in order to highlight the most profitable trades. Open your PaxForex Trading Account today and position yourself for profits ahead.
One hope was that Japanese investors would buy US Treasuries as the Japanese Yen continues to strengthen, which would push yield lower. This may not happen in the current environment and Chief Fund Manager Hideaki Kuriki of Sumitomo Mitsui Trust Asset Management stated that ‘Japanese investors were buying Treasuries when a rise in yields was pushing up the dollar, but that correlation started to break down in December. Their appetite for US bonds has now been limited, and local investors have been unwinding their positions as the dollar-yen’s outlook starts to deteriorate.’ Forex traders should closely monitor developments in the bond market in order to be in front of the curve if Bondageddon does materialize. Bondageddon and your forex portfolio is the theme song moving forward in the next weeks and here are three forex trades to capture the music.
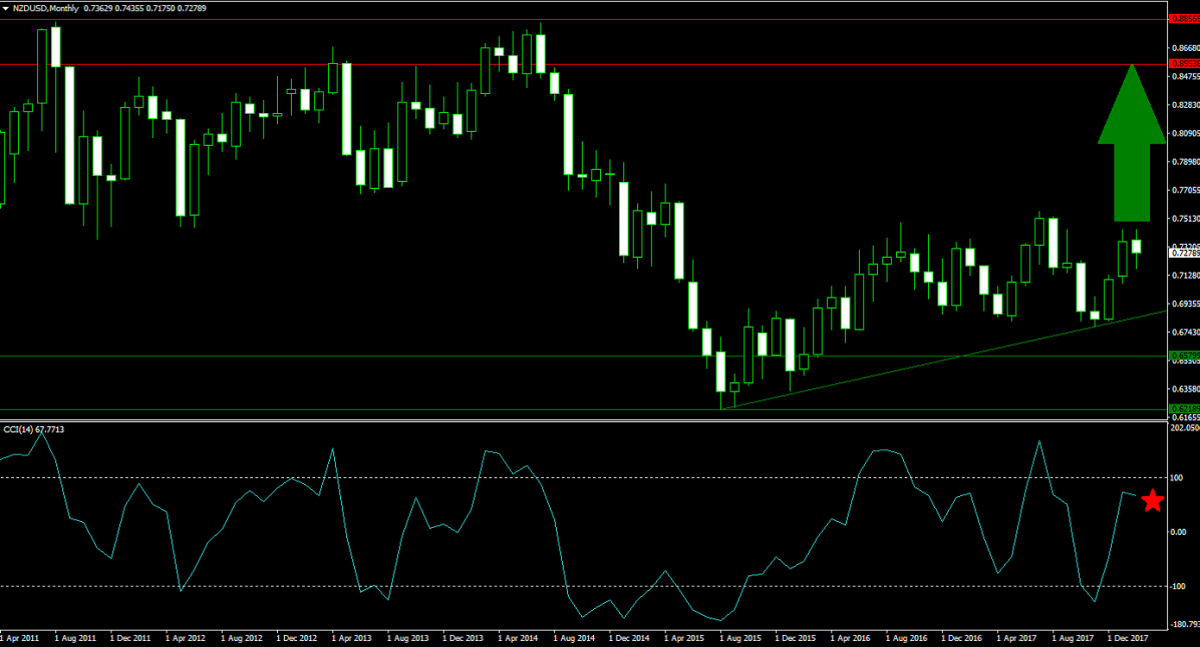
Forex Profit Set-Up #1; Buy NZDUSD - MN Time-Frame
As the US Dollar is predicted to continue its move to the downside, the NZDUSD is set for an extension of its advance. After a breakout above its horizontal support area, this currency pair drifted to the upside. The formation of an ascending support level continues to pressure price action higher which can take the NZDUSD back into its horizontal resistance area. Forex traders are recommended to buy the dips down into the ascending support level in order to capitalize on the expected advance into the second-quarter.
The CCI briefly dipped below the -100 mark which identifies extreme oversold conditions, but advanced sharply with the breakout in price action. Expected dips in the NZDUSD to its ascending support level will also lower this indicator to attractive entry levels. Subscribe to the PaxForex Daily Forex Technical Analysis and benefit from the expertise of our analysts in identifying the best technical trades each day.
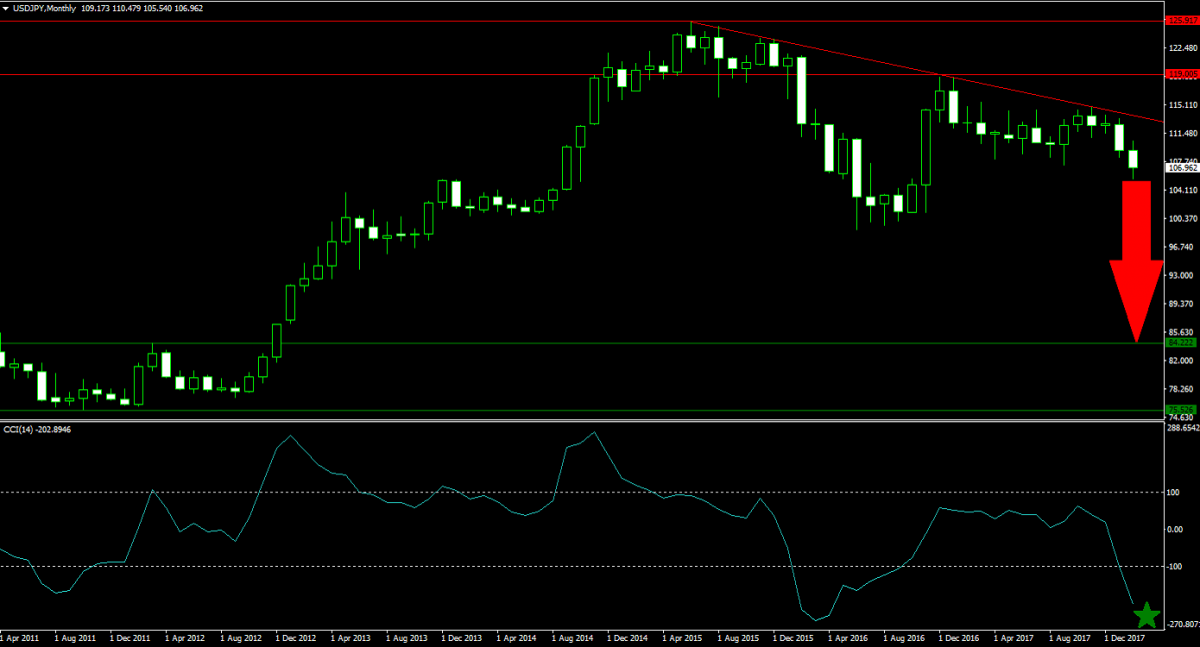
Forex Profit Set-Up #2; Sell USDJPY - MN Time-Frame
The Japanese Yen has been rallying for an extended period of time and even the Bank of Japan is now worried about the Yen’s strength. This worry is unlikely to stop the capital inflow into this safe haven currency. After the breakdown from its horizontal resistance area, the USDJPY is on a clear downward trajectory which enjoys the momentum swing to bearish. A descending resistance level further pushed this currency pair to the downside, and a breakdown below it will clear the way into its horizontal support area. Forex traders are advised to buy the rallies following the breakdown in order to minimize risk and increase profit potential.
The CCI already collapsed well below the -100 level and is now in deep extreme oversold territory. Given its previous low during a pull-back in price action, the CCI has more room to the downside and any brief rally will lift this indicator temporarily. The PaxForex Daily Fundamental Analysis offers insights on each trading day’s fundamental factors which will influence your forex portfolio. Earn over 500 pips every month with the help of our expert analysts.
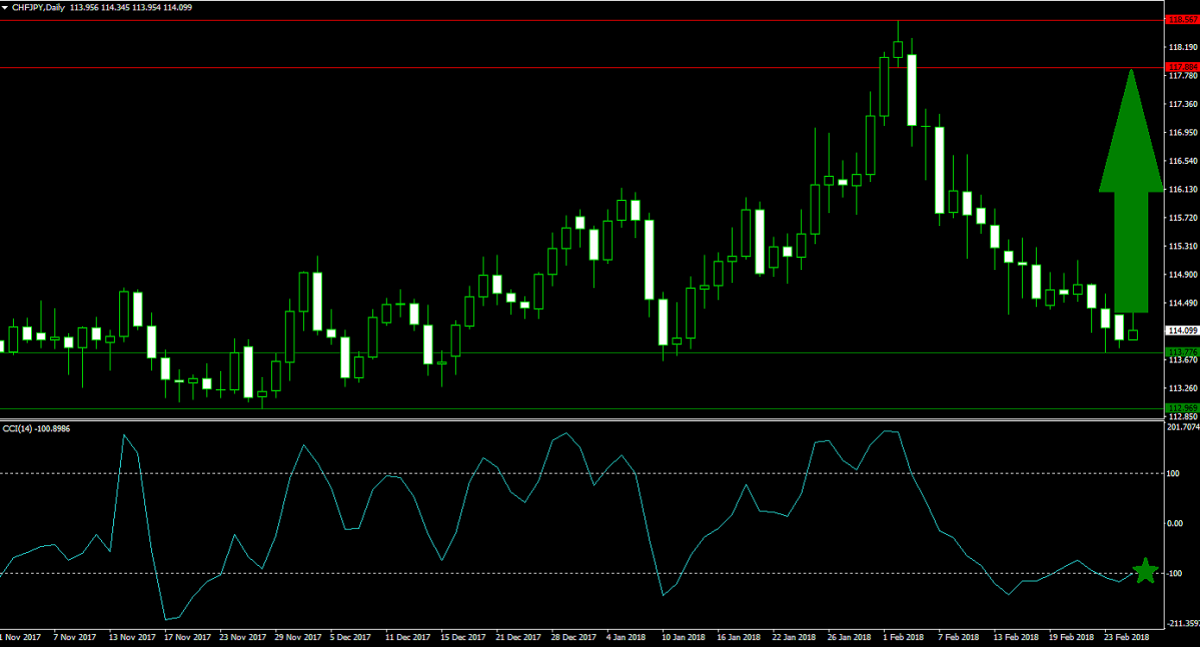
Forex Profit Set-Up #3; Buy CHFJPY - D1 Time-Frame
The CHFJPY on the D1 time-frame offers forex traders a great hedge to the above mentioned MN time-frame positions. The current correction in this currency pair took price action down into the upper level of its horizontal support area. Downside risk remains limited from current levels while upside potential is attractive. The CHFJPY is poised to reverse its correction should Japanese investors decide to add to US Treasuries. Forex traders are recommended to spread their buy orders inside the 113.000 and 113.800 area.
The CCI, a momentum indicator, is trading in and out of the -100 mark and additionally formed a positive divergence which is a strong bullish indicator. A move higher from current levels is anticipated which will push the CCI above the 0 level for a bullish momentum change. Download your PaxForex MT4 Trading Platform now and add this trade to your forex portfolio before it will accelerate to the upside.
To receive new articles instantly Subscribe to updates.