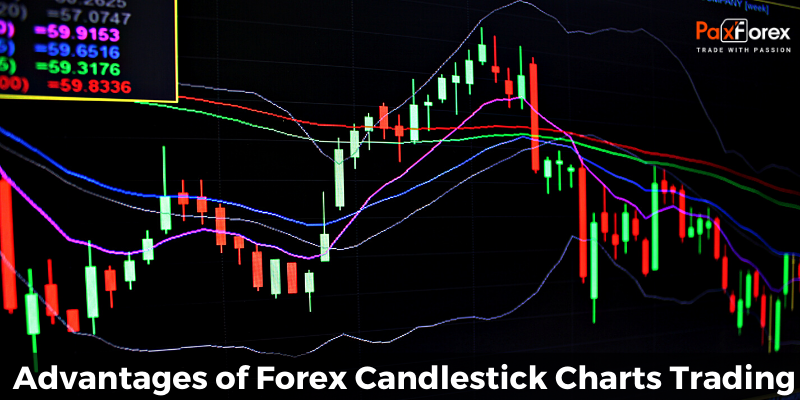
Over the last few decades, traders have begun to use candlestick charts far more frequently than any other technical analysis tool. Candlestick charts have a simple, easy-to-analyze appearance, and provide more detailed information about the market at a glance than bar or line charts. Candlestick charts are a technical tool that packs data for multiple time frames into single price bars. This makes them more useful than traditional open-high, low-close bars (OHLC)or simple lines that connect the dots of closing prices.
The most popular chart type is definitely the candlestick chart. For the forex, stock, futures and commodities traders, the candlestick chart has proven to be effective in illustrating market price movements. It shows all the relevant market price points within a trading period. On a candlestick chart, a trader is able to know the opening/closing prices as well as the high/low points in the markets during that trading period and hence know the prevailing market sentiment. They are visually appealing.
The major advantage candlesticks chart patterns are that they provide investors with an easy-to-read system with which to view any changes that might occur in supply and demand. Simply by using candlestick chart patterns to perform critical day analysis, investors can find evidence of any trend reversals in time. This serves as an advance warning to investors about how the market will move. Used in combination with other methods and with market indicators, Candlesticks can provide investors with a lot of potentials to profit in trading.
Forex candlestick charts can be invaluable tools when considering the choices that are presented. By learning to read and use them, a forex trader can gain distinct advantages in decision-making on the foreign exchange market. A candlestick chart, alternately, will show you what a bar chart does as well as give you a pictorial representation of the range between an opening and closing period. With this information in hand, you can make well thought out and considered decisions.
Forex traders need a candlestick chart to read prices because they are a product of supply and demand and they are subject to many factors aside from prevailing economic conditions. Prices are also affected by fundamental forces as well as many human emotions such as greed, panic, fear, or even hysteria. These emotions often cause dramatic changes in prices. Many of the movements that occur in the market are not always based on fact but on expectations. When used in conjunction with other forms of analysis, candlestick patterns can be a useful indicator of potential trend reversals and price breakouts in the market, helping you to build a stronger and more effective trading strategy.


