
This week saw plenty of turbulence as well as a capitulation sell-off in the British Pound Sterling which saw its exchange rate tumbling to multi-month lows (What happened to the British Pound Exchange Rate?). The GBP was forced lower by twin-negative minutes out of the Bank of England which struck a more dovish tone as well as the U.S. Federal Reserve which temporarily sounded more hawkish. We expect to witness a rebound after the capitulation sell-off. The European Commission revised its 2013 growth estimates lower and now expects...

The USDCAD has rallied over the past few sessions and formed a double top formation as visible in this H4 chart. We believe this pair will correct down to its rising support level and potentially down to its 200 DMA from where the next move can unfold. MACD has declined in comparison to the first peak it formed and therefore does not confirm strength behind the recent move higher which add validity to the double top formation. RSI has reached overbought territory and a break below this level should accelerate the correction. We...
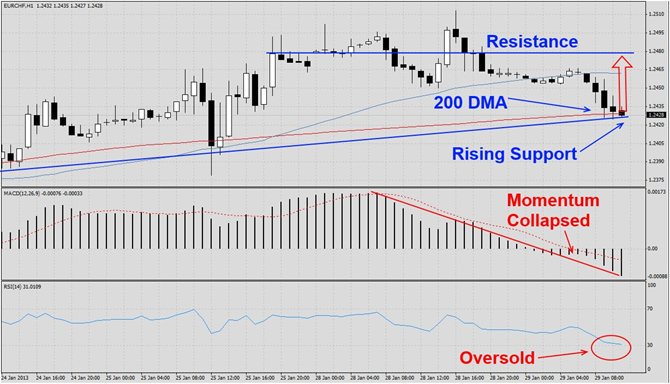
The EURCHF has corrected from its recent highs down into its rising support level as visible in this H1 chart. The support level is reinforced by the pairs 200 DMA and we believe this pair will bounce back into its current resistance zone which is made up by its 50 DMA and its most recent resistance level. MACD has collapsed during the correction which hints at potential future weakness for the EURCHF after a minor rally. RSI has reached oversold territory and a breakout from its current level should accelerate the rally back into...
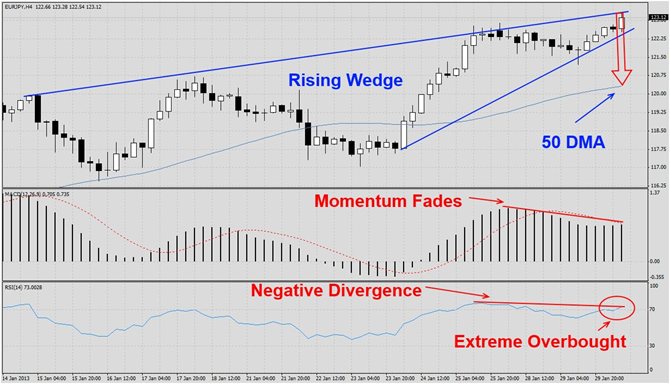
The EURJPY has traded higher from its lows and formed a rising wedge formation as visible in this H4 chart. The move has been quite powerful and we believe this pair will rest and contract down to its rising 50 DMA before future upside may be possible. A minor correction from here would be healthy and ensure further upside. MACD has supported the rally and remained in bullish territory, but it started to show weakness during the most recent spike higher. It has formed a negative divergence and suggests that the trend will reverse...
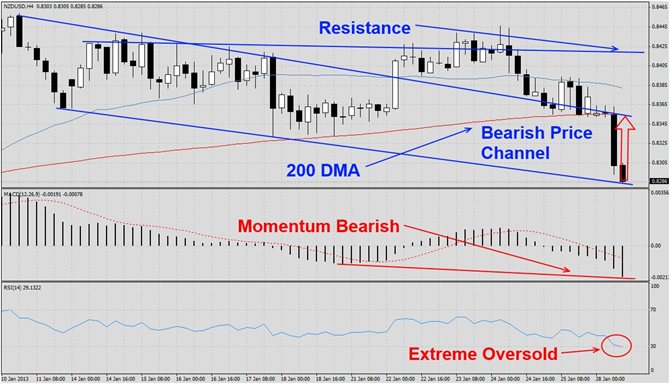
The USDNZD has been trading in a bearish price channel as visible in this H4 chart. This pair has now touched its descending support line and should be able to launch a rally which should take it back to its 200 DMA as well as its descending resistance level of its current chart pattern. MACD indicates bearishness and confirms the bearish price channel. We expect momentum to stabilize and improve slightly during the rally. RSI has reached extreme oversold territory and points to a change in direction. A breakout from current...