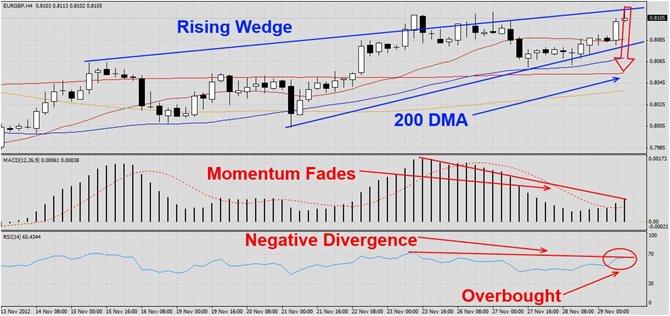
The EURGBP has rallied from its lows after briefly breaching its 100 DMA as visible in this H4 chart and formed a rising wedge formation. This pair has traded within the parameters of its formation. The most recent candlestick patter formed an inverted hammer at the top of its formation which indicates bearishness ahead. MACD has formed a negative divergence and shows that momentum has faded as this pair moved higher. We expect this pair to breakdown into its 200 DMA. RSI has reached overbought territory and also formed a negative...
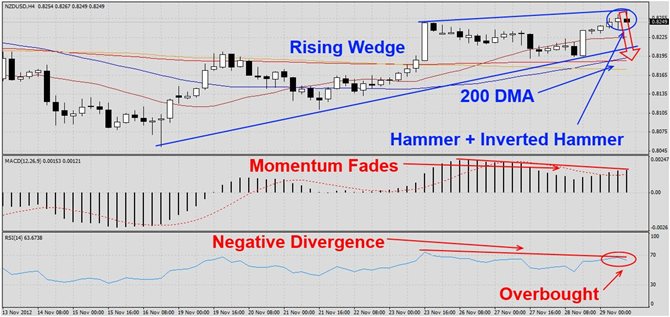
The NZDUSD has rallied from its most recent lows and formed a rising wedge formation as visible in this H4 chart. The pair currently trades at the upper resistance level and the two most recent candlestick patterns formed a hammer as well as inverted hammer formation which are both two extremely bearish signs given their position. MACD has formed a negative divergence and shows that momentum fades away. We expect this pair to breakdown into its 200 DMA. RSI has reached overbought territory and formed a negative divergence as well...

November came to a close and we finished the week with 350 pips in profits which reduced our monthly loss to 170 pips. This was the first time in our history in which we recorded a monthly trading loss which came on the back of a calculated exit during the first week of November for a loss of 850 pips. The following three weeks we earned a combined 680 pips. The British Pound has been our worst performer and caused our floating trading losses to increase drastically this month as the Bank of England unexpectedly decided to reduce...