The CHFJPY has rallied after a breakdown of it rectangular chart pattern as visible in this D1 chart. The CHFJPY has been trading within its rectangular chart pattern and only pierced it to the downside once in order to touch its ascending 50 DMA. This currency pair now trades at its horizontal resistance level and we expect it to correct back down to its horizontal support level which is also enforced by its ascending 50 DMA. MACD has just completed a bullish centerline crossover, but we expect this to reverse and classify it as a...
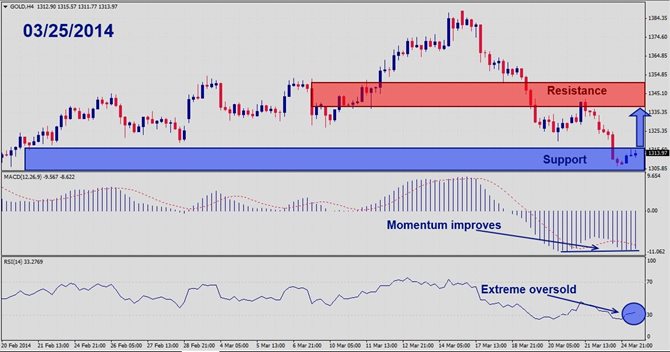
Should price action for Gold remain inside the 1,305 to 1,315 zone the following trade set-up is recommended: Timeframe: H4 Recommendation: Long Position Entry Level: Long Position @ 1,310 Take Profit Zone: 1,330 – 1,345 Stop Loss Level: 1,290 Should price action for Gold breakout above 1,320 the following trade set-up is recommended: Timeframe: H4 Recommendation: Long Position Entry Level: Long Position @ Retracements in the trend; buy orders during dips Take Profit Zone: 1,330 – 1,345 Stop Loss Level: 1,290...

Should price action for the USDJPY remain inside the 102.30 to 102.50 zone the following trade set-up is recommended: Timeframe: H4 Recommendation: Short Position Entry Level: Short Position @ 102.45 Take Profit Zone: 101.00 – 101.30 Stop Loss Level: 103.10 Should price action for the USDJPY breakdown below 102.30 the following trade set-up is recommended: Timeframe: H4 Recommendation: Short Position Entry Level: Short Position @ Retracements in the trend; sell orders during rallies Take Profit Zone: 101.00 – 101.30...

The GBPJPY has rallied sharply due to a combination of market manipulation from the Bank of Japan as well as a short covering rally which lifted the Pound Sterling. This currency pair has formed a rising wedge formation as visible in the H4 chart. Price action is currently centered at ascending support levels with a pending breakdown of the chart formation imminent. We call this currency pair lower from current levels amid profit taking. MACD has formed a negative divergence and does not confirm the higher highs set by this...

The EURGBP has rallied from its 200 DMA and entered a narrow rising wedge formation as visible in this H4 chart. This pair has tried to form a top over the past two sessions and is prepared for a breakdown which should take this pair back down to its 200 DMA. MACD shows a decrease in momentum over the past few sessions and has formed a negative divergence. RSI has traded in extreme overbought territory and formed a negative divergence as well. A breakdown from extreme territory should accelerate the sell-off. We recommend a short...