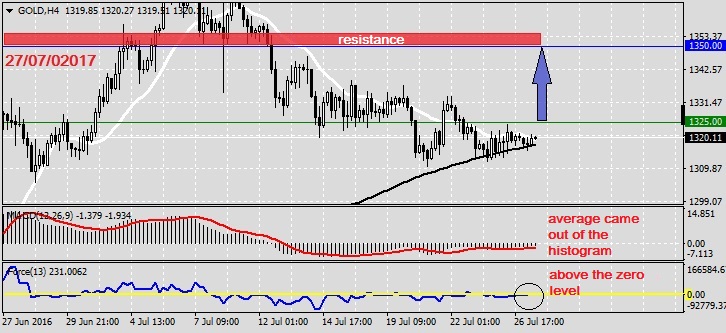
The price above 200 MA, indicating a growing trend. The MACD histogram is above the zero line. The oscillator Force Index is above the zero line. If the level of resistance is broken, you should follow recommendations below: • Timeframe: H4 • Recommendation: Long Position • Entry Level: Long Position 1325 • Take Profit Level: 1350 (2500 pips) If the price rebound from resistance level, you should follow recommendations below: • Timeframe: H4...
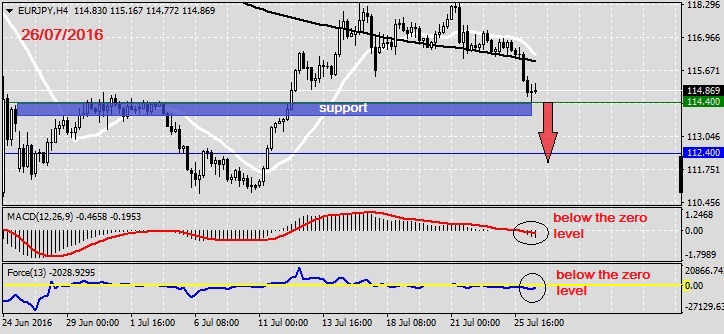
The price is below the moving average MA 200 and 20 MA, indicating the downward trend. The MACD is below the zero level. The oscillator Force Index is below the zero level. If the price rebound from resistance level, you shall follow recommendations below: • Timeframe: H4 • Recommendation: Short Position • ...
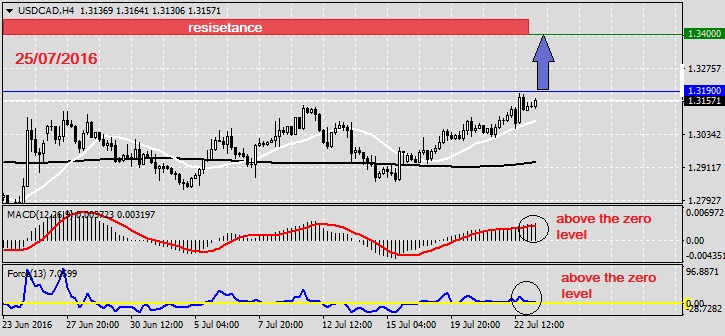
The price above 200 MA, indicating a growing trend. The MACD histogram is above the zero line. The oscillator Force Index is above the zero line. If the level of resistance is broken, you should follow recommendations below: • Timeframe: H4 • Recommendation: Long Position • Entry Level: Long Position 1.3190 •...
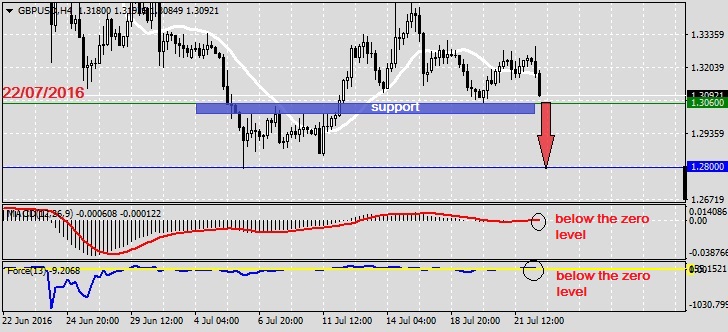
The price is below the moving average MA 200 and 20 MA, indicating the downward trend. Average in the MACD is below the zero level. The oscillator Force Index is below the zero level. If the price rebound from resistance level, you shall follow recommendations below: • Timeframe: H4 • Recommendation: Short Position • ...
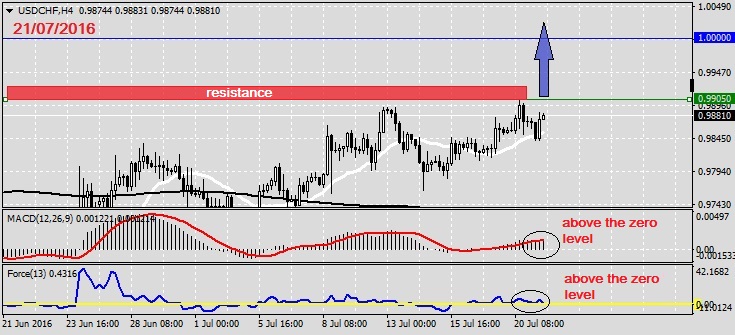
The price above 20 MA and 200 MA, indicating a growing trend. The MACD is above the zero line. The oscillator Force Index is above the zero line. If the level of resistance is broken, you should follow recommendations below: • Timeframe: H4 • Recommendation: Long Position • Entry Level: Long Position 0.9905 •...