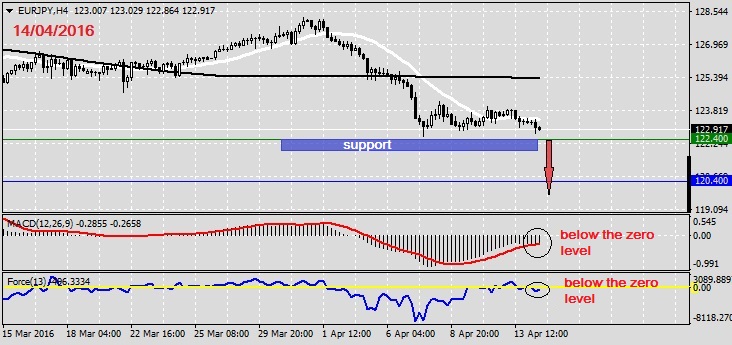
The price is below the moving average MA 200 and 20 MA, indicating the downward trend. The MACD is below the zero level. The oscillator Force Index is below the zero level. If the price rebound from resistance level, you shall follow recommendations below: • Timeframe: H4 • Recommendation: Short Position • ...
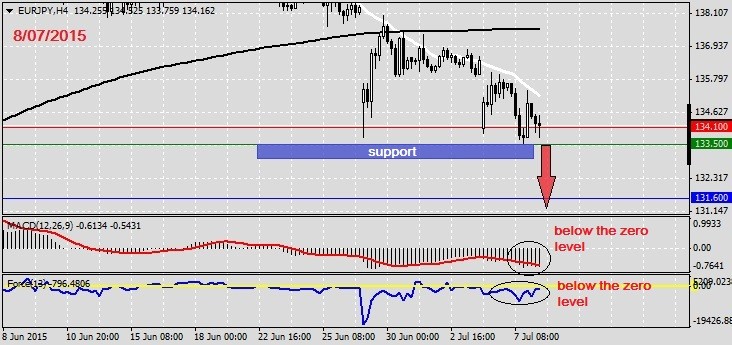
The price is below the moving average MA 200 and 20 MA, indicating the downward trend. The MACD is below the zero level. The oscillator Force Index is below the zero level. If the price rebound from resistance level, you shall follow recommendations below: • Timeframe: H4 • Recommendation: Short Position • ...
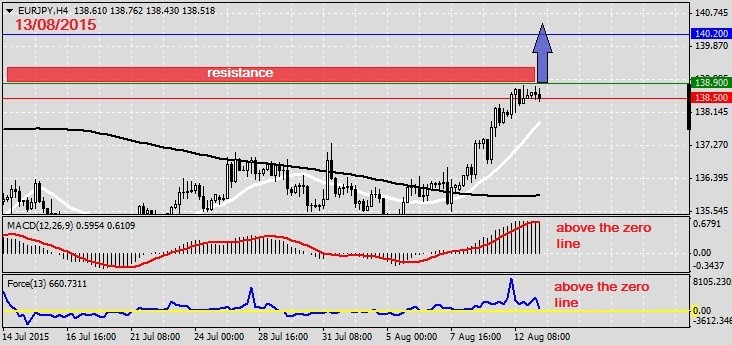
The price above MA 200 and 20 MA, indicating a growing trend. The MACD histogram is above the zero line. The oscillator Force Index is above the zero line. If the level of resistance is broken, you should follow recommendations below: • Timeframe: H4 • Recommendation: Long Position • Entry Level: Long Position 138...
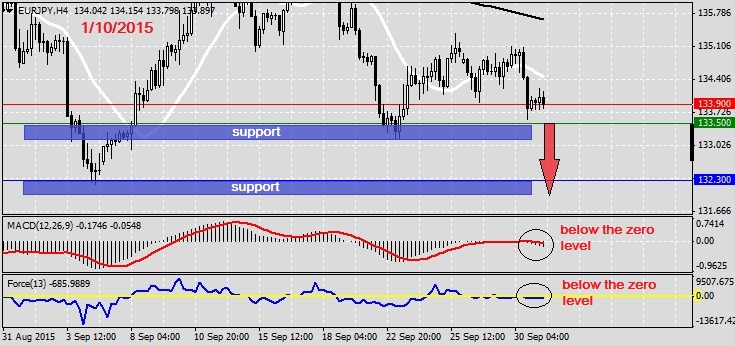
The price is below the moving average 20 MA and MA 200, indicating the downward trend. Average in the MACD is below the zero level. The oscillator Force Index is below the zero level. If the price rebound from resistance level, you shall follow recommendations below: • Timeframe: H4 • Recommendation: Short Position • Entry Level: Short Position 133....
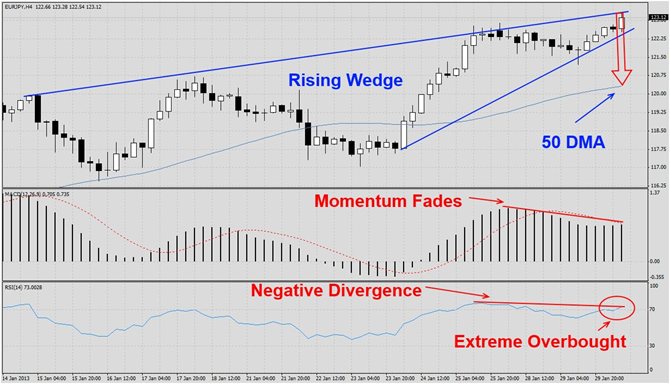
The EURJPY has traded higher from its lows and formed a rising wedge formation as visible in this H4 chart. The move has been quite powerful and we believe this pair will rest and contract down to its rising 50 DMA before future upside may be possible. A minor correction from here would be healthy and ensure further upside. MACD has supported the rally and remained in bullish territory, but it started to show weakness during the most recent spike higher. It has formed a negative divergence and suggests that the trend will...