
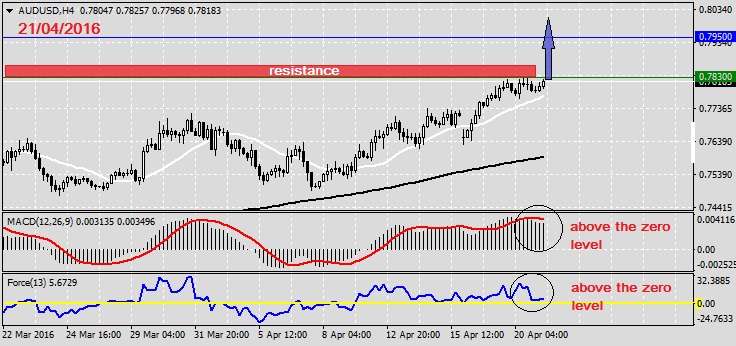
The price above 20 MA and 200 MA, indicating a growing trend. The MACD histogram is above the zero line. The oscillator Force Index is above the zero line. If the level of resistance is broken, you should follow recommendations below: • Timeframe: H4 • Recommendation: Long Position • Entry Level: Long Position 0....
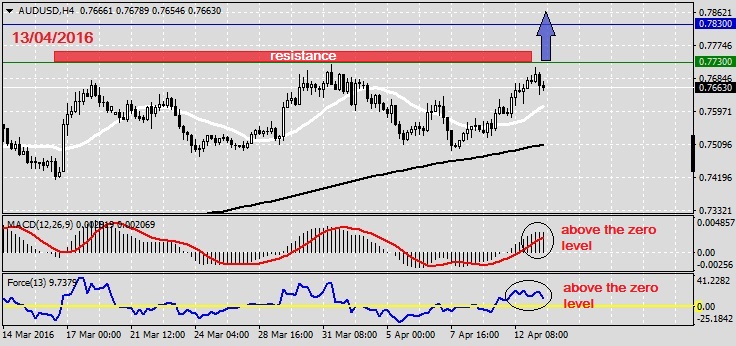
The price above 20 MA and 200 MA, indicating a growing trend. The MACD histogram is above the zero line. The oscillator Force Index is above the zero line. If the level of resistance is broken, you should follow recommendations below: • Timeframe: H4 • Recommendation: Long Position • Entry Level: Long Position 0....
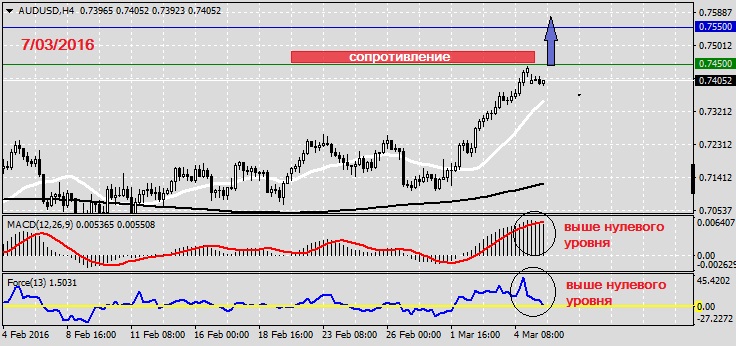
The price above 20 MA and 200 MA, indicating a growing trend. The MACD histogram is above the zero line. The oscillator Force Index is above the zero line. If the level of resistance is broken, you should follow recommendations below: • Timeframe: H4 • Recommendation: Long Position • Entry Level: Long Position 0....
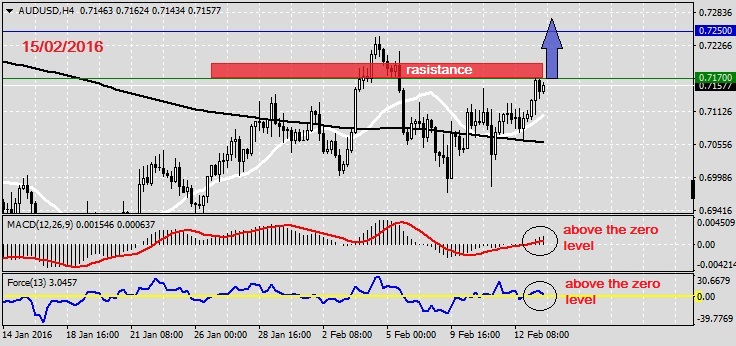
The price above 200 MA, indicating a growing trend. The MACD histogram is above the zero line. The oscillator Force Index is above the zero line. If the level of resistance is broken, you should follow recommendations below: • Timeframe: H4 • Recommendation: Long Position • Entry Level: Long Position 0.7170 • ...
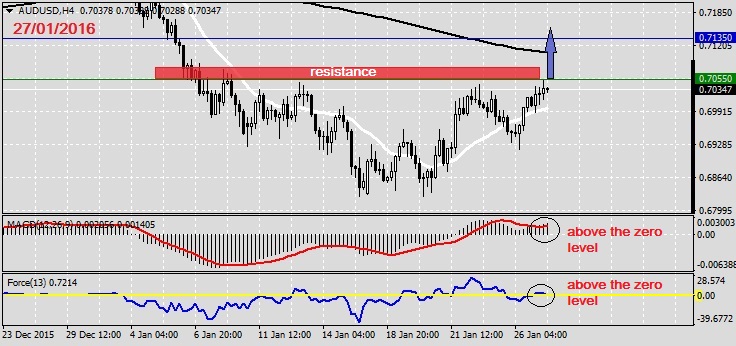
The price above 200 MA, indicating a growing trend. The MACD histogram is above the zero line. The oscillator Force Index is above the zero line. If the level of resistance is broken, you should follow recommendations below: • Timeframe: H4 • Recommendation: Long Position • Entry Level: Long Position 0.7055 • ...