


Source: PaxForex Premium Analytics Portal, Technical Insight
U.S. stock indices declined on Thursday after the release of data on the number of new jobless claims in the U.S. last week and on home construction in January. The Standard & Poor's 500 fell 17.36 points (0.44%) to 3,913.97 points.
S&P 500, H4
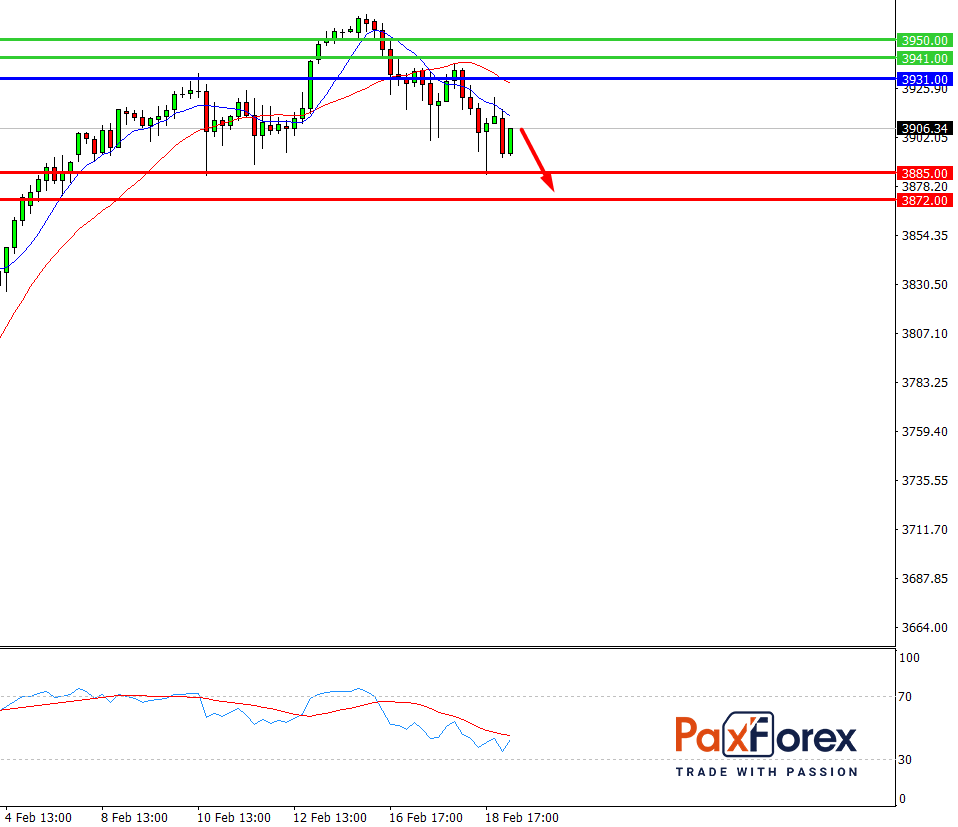
Pivot: 3919.00
Analysis:
Provided that the index is traded below 3931.00, follow the recommendations below:
- Time frame: H4
- Recommendation: short position
- Entry point: 3919.00
- Take Profit 1: 3885.00
- Take Profit 2: 3872.00
Alternative scenario:
In case of breakout of the level 3931.00, follow the recommendations below:
- Time frame: H4
- Recommendation: long position
- Entry point: 3931.00
- Take Profit 1: 3941.00
- Take Profit 2: 3950.00
Comment:
RSI indicates a downtrend during the day.
Key levels:
| Resistance | Support |
| 3950.00 | 3885.00 |
| 3941.00 | 3872.00 |
| 3931.00 | 3860.00 |
S&P 500, D1
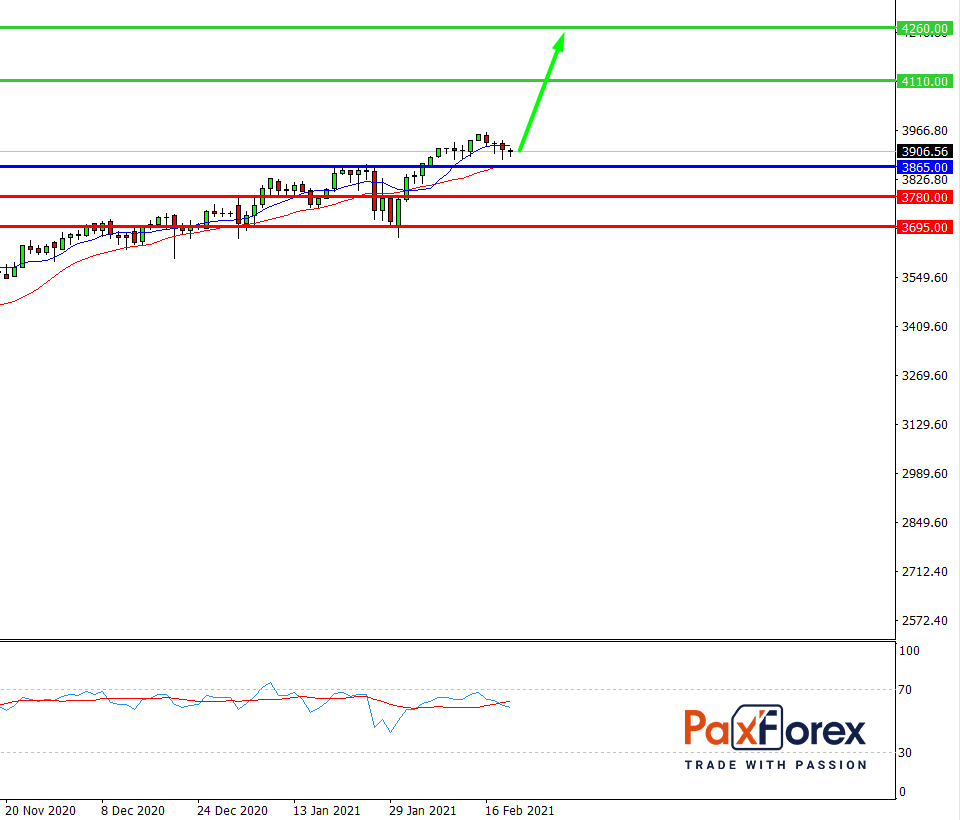
Pivot: 3921.00
Analysis:
While the price is above 3865.00, follow the recommendations below:
- Time frame: D1
- Recommendation: long position
- Entry point: 3921.00
- Take Profit 1: 4110.00
- Take Profit 2: 4260.00
Alternative scenario:
If the level 3865.00 is broken-down, follow the recommendations below:
- Time frame: D1
- Recommendation: short position
- Entry point: 3865.00
- Take Profit 1: 3780.00
- Take Profit 2: 3695.00
Comment:
RSI is bullish and indicates further increase.
Key levels:
| Resistance | Support |
| 4450.00 | 3865.00 |
| 4260.00 | 3780.00 |
| 4110.00 | 3695.00 |


