


Source: PaxForex Premium Analytics Portal, Technical Insight
U.S. stock indices declined in trading on Monday due to investors' reluctance to open new positions at the start of a week full of quarterly company reports and economic statistics. The S&P 500 declined 0.81 points (0.02%) to 4127.99 points.
S&P 500, H4
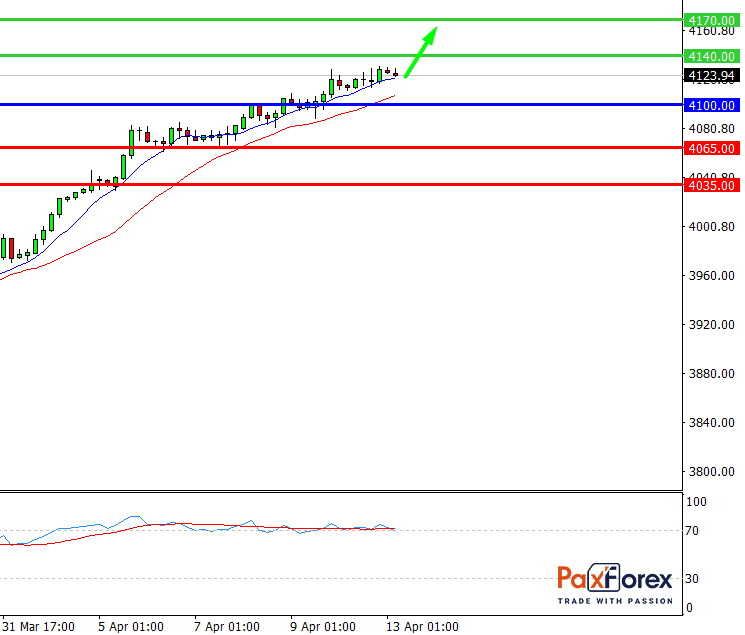
Pivot: 4128.00
Analysis:
Provided that the index is traded above 4100.00, follow the recommendations below:
- Time frame: H4
- Recommendation: long position
- Entry point: 4128.00
- Take Profit 1: 4140.00
- Take Profit 2: 4170.00
Alternative scenario:
In case of breakdown of the level 4100.00, follow the recommendations below:
- Time frame: H4
- Recommendation: short position
- Entry point: 4100.00
- Take Profit 1: 4065.00
- Take Profit 2: 4035.00
Comment:
RSI indicates an uptrend during the day.
Key levels:
| Resistance | Support |
| 4300.00 | 4100.00 |
| 4170.00 | 4065.00 |
| 4140.00 | 4035.00 |
S&P 500, D1
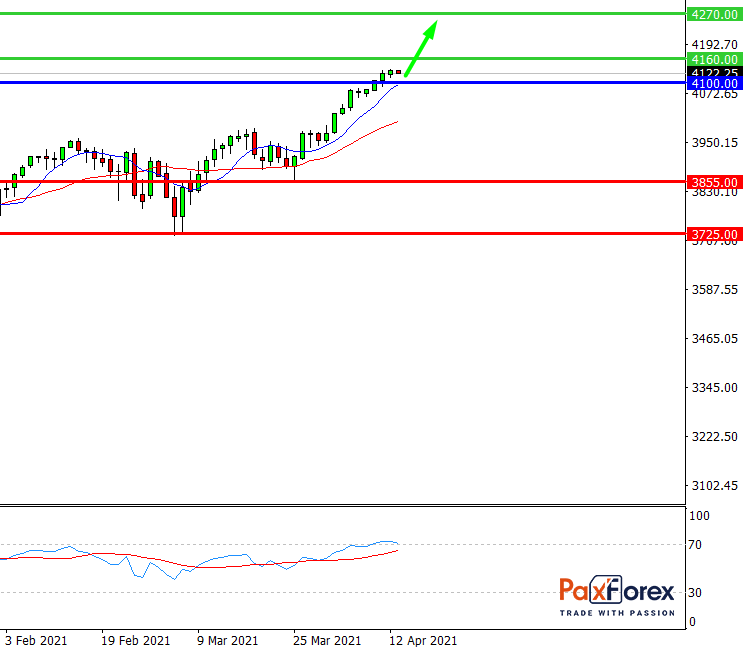
Pivot: 4128.00
Analysis:
While the price is above 3980.00, follow the recommendations below:
- Time frame: D1
- Recommendation: long position
- Entry point: 4128.00
- Take Profit 1: 4160.00
- Take Profit 2: 4270.00
Alternative scenario:
If the level 3980.00 is broken-down, follow the recommendations below:
- Time frame: D1
- Recommendation: short position
- Entry point: 3980.00
- Take Profit 1: 3855.00
- Take Profit 2: 3725.00
Comment:
RSI is bullish and indicates further increase.
Key levels:
| Resistance | Support |
| 4450.00 | 3980.00 |
| 4270.00 | 3855.00 |
| 4160.00 | 3725.00 |


