


Source: PaxForex Premium Analytics Portal, Technical Insight
U.S. stock indices increased at the end of trading on Friday, despite disappointing data on job growth in the United States. However, as noted by MarketWatch, four major indicators (Dow Jones, S&P 500, Nasdaq, and Russell 2000) closed trading at record high levels. The last time they updated records on one day was January 22, 2018, according to Dow Jones Market Data.
S&P 500, H4
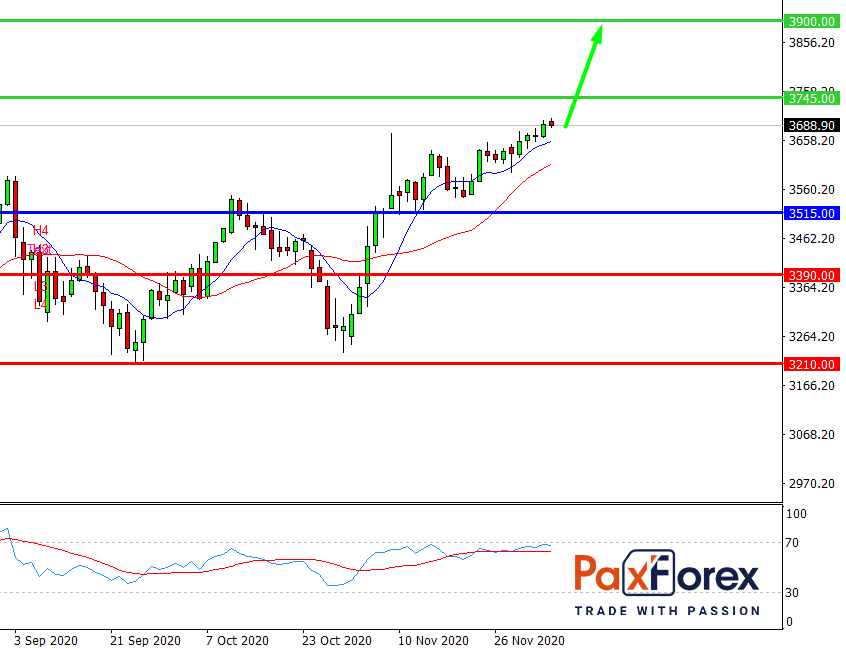
Pivot: 3692.00
Analysis:
Provided that the index is traded above 3515.00, follow the recommendations below:
- Time frame: H4
- Recommendation: long position
- Entry point: 3692.00
- Take Profit 1: 3745.00
- Take Profit 2: 3900.00
Alternative scenario:
In case of breakdown of the level 3515.00, follow the recommendations below:
- Time frame: H4
- Recommendation: short position
- Entry point: 3515.00
- Take Profit 1: 3390.00
- Take Profit 2: 3210.00
Comment:
RSI indicates an uptrend during the day.
Key levels:
| Resistance | Support |
| 4070.00 | 3515.00 |
| 3900.00 | 3390.00 |
| 3745.00 | 3210.00 |
S&P 500, D1
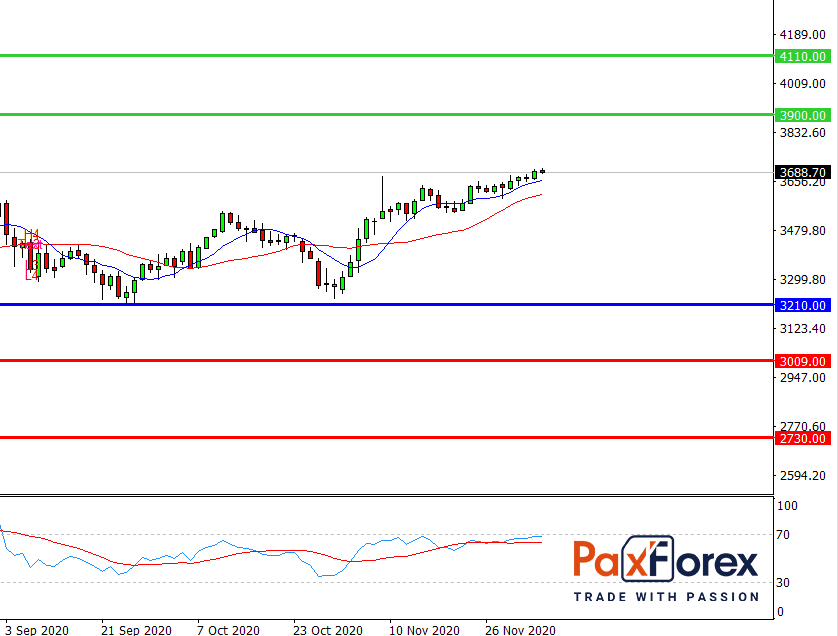
Pivot: 3688.00
Analysis:
While the price is above 3210.00, follow the recommendations below:
- Time frame: D1
- Recommendation: long position
- Entry point: 3688.00
- Take Profit 1: 3900.00
- Take Profit 2: 4110.00
Alternative scenario:
If the level 3210.00 is broken-down, follow the recommendations below.
- Time frame: D1
- Recommendation: short position
- Entry point: 3210.00
- Take Profit 1: 3009.00
- Take Profit 2: 2730.00
Comment:
RSI is bullish and indicates further increase.
Key levels:
| Resistance | Support |
| 4250.00 | 3210.00 |
| 4110.00 | 2965.00 |
| 3900.00 | 2730.00 |


