Source: PaxForex Premium Analytics Portal, Technical Insight
Biden sounded optimistic in his first address to Congress: "America is ready to take off, and the crisis is turning into an opportunity..." The rising stock indices echoed this, and the return of risk appetite is once again provoking the dollar's recovery against the Japanese yen.
The president called for a fundamental change in the way the government works to increase competitiveness in the foreign market. Emphasis was placed on access to education and support for low-income families. To do this, Joe Biden proposed to allocate another $1.8 trillion, part of which should be used as follows:
- $200 billion to go to preschool to support families with three- and four-year-olds. It would save families up to $13,000;
- $109 billion - to make the first two years of college free;
- $225 billion - allocate to increase child care benefits;
- $425 billion to use to reduce premiums under the Affordable Care Act.
Much of the new budget spending should be offset by wealthy Americans: the proposed tax levies would raise about $1.5 trillion over the next 10 years. For example, the top tax rate for the wealthy would rise from 37% to 39.6%, while the corporate and estate income tax would jump from 20% to 39.6%.
The stock market liked Biden's plans: during the first 100 days of presidency, the S&P500 index grew by 10.1% and the Dow Jones rose by 9.3%. Thus, Biden became the second U.S. president by the strength of the growth of the stock market in the first 100 days of his presidency.
The measures taken by the government have already reduced unemployment from its peak. The labor market is expected to reach pre-crisis levels as soon as next year, and GDP growth rates may exceed 6% this year.
The rapid economic recovery leads to a desire of investors to invest in risky assets, due to which the demand for government bonds is reduced.
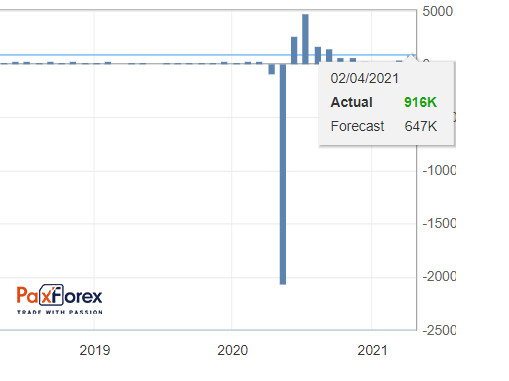
Non-Farm Payrolls Employment
Last data: 916K
Consensus Forecast: 978K
The Non-Farm employment change measures the change in the number of people employed during the last month in the non-farm sector. Total Non-Farm Payrolls represent about 80% of the workers who produce all of the Gross Domestic Product of the United States.
It is the most important piece of data contained in the employment report that offers the best overview of the economy.
Monthly changes and adjustments in the data can be very volatile.
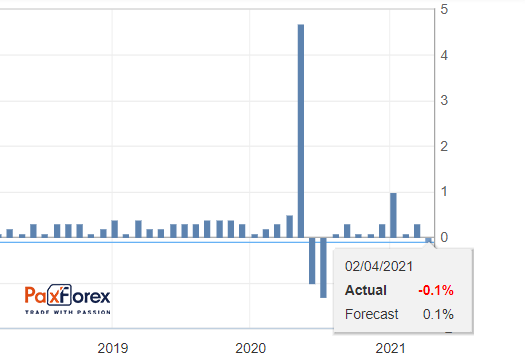
U.S. Average Hourly Earnings YoY
Last data: 0.1%
Consensus forecast: -0.1%
This indicator shows the change in the average hourly wage level for major industries, except agriculture.
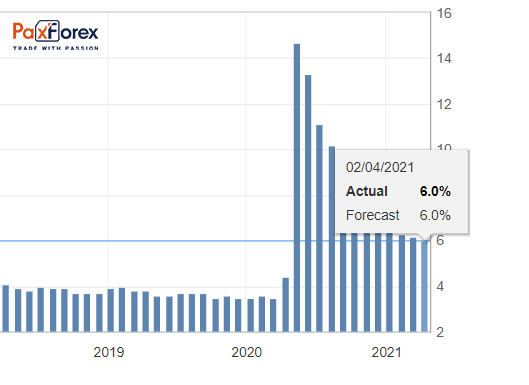
Unemployment Rate
Past data: 6.0%
Consensus forecast: 5.7%
The unemployment rate measures the percentage of the total labor force that is unemployed but actively looking for a job and willing to work in the United States.
A high percentage indicates weakness in the labor market. A low percentage is positive for the U.S. labor market and should be taken as a positive factor for the USD.
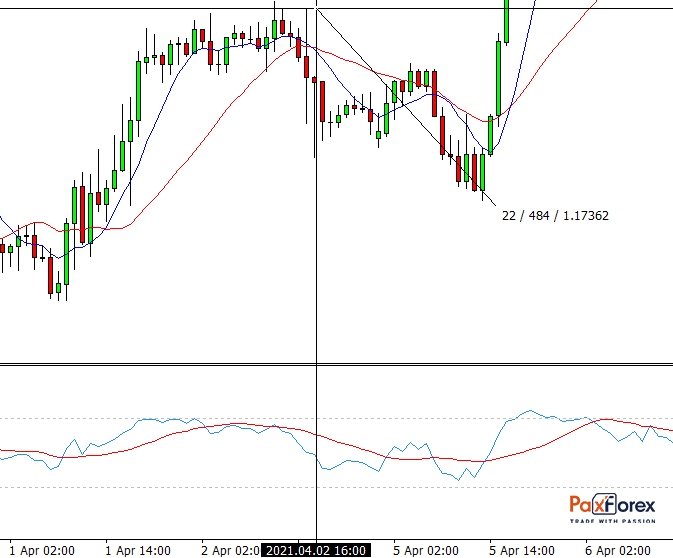
In the previous release of data, the movement on the EUR/USD currency pair at that moment made 37 points:
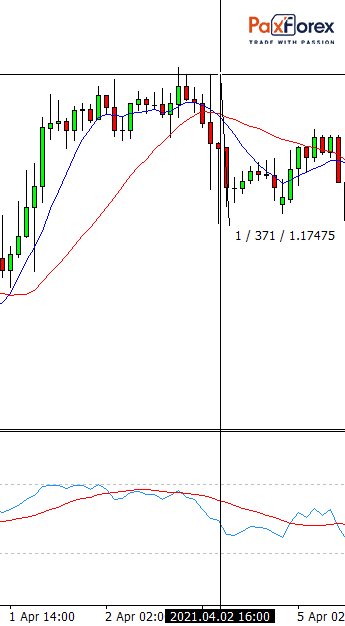
At the same time, having developed movement at 48 points within a few days: