


The NZD/USD currency pair at 0.6085 and keeps moving within the correction. The pair is traded above the upper boundary of the Ichimoku Kinko Hyo Indicator Cloud. This indicates that there is a sideways trend.
NZD/USD, 30 min
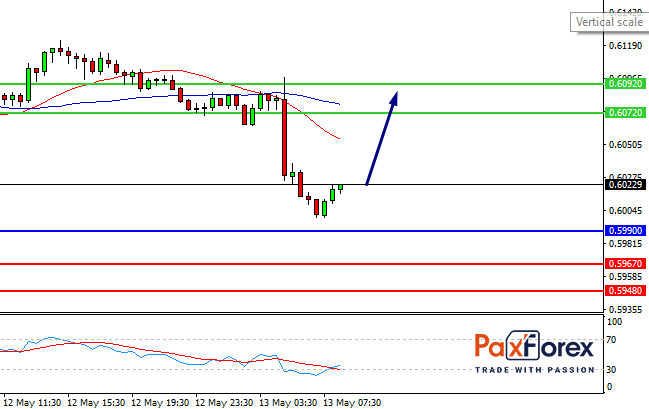
Pivot: 0.6010
The NZD/USD currency pair at 0.6085 and keeps moving within the correction. The pair is traded above the upper boundary of the Ichimoku Kinko Hyo Indicator Cloud. This indicates that there is a sideways trend.
Pivot: 0.6010
Provided that the currency pair is traded above 0.5990, follow the recommendations below:
In case of breakdown of the level 0.5990 follow the recommendations below:
RSI shows an uptrend development during the day.
| Resistance | Support |
| 0.6092 | 0.5967 |
| 0.6072 | 0.5948 |
| 0.6040 | 0.5928 |
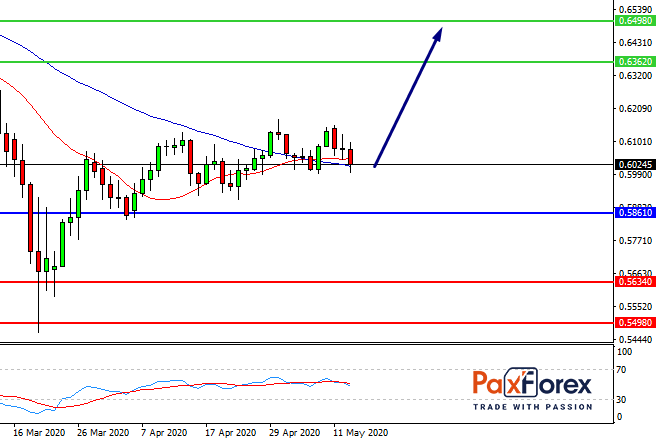
Pivot: 0.6087
While the price is above 0.5861, follow the recommendations below:
If the level 0.5861 is broken-down, follow the recommendations below.
RSI is above 50. MACD is positive and above the signal line. The configuration is positive. Moreover, the pair trades above its 20 and 50 moving averages (by 0.6044 and 0.6023 respectively).
| Resistance | Support |
| 0.6634 | 0.5861 |
| 0.6498 | 0.5634 |
| 0.6362 | 0.5498 |
AUD/USD – sell below 0.6495 with 0.6450 and 0.6430 as Take Profit targets. Alternative scenario - if the level of 0.6495 is broken-out, you should consider selling with the targets 0.6515 and 0.6535 as Take Profit.
USD/CAD - short positions below 1.4080 with 1.4000 and 1.3970 targets as Take Profit. Alternative scenario - if the level of 1.4080 is broken-out, buy with the targets 1.4115 and 1.4150 as Take Profit.
EUR/USD – sell below 1.0865 with 1.0835 and 1.0815 targets as Take Profit. Alternative scenario - if the level 1.0865 is broken-out, buy with the TP 1.0885 and 1.0900.
To receive new articles instantly Subscribe to updates.


