Source: PaxForex Premium Analytics Portal, Technical Insight
U.S. stock indices declined sharply in last January trading, with the Dow and S&P 500 indicators suffering their biggest losses in a month since October amid volatility due to fears of a market bubble over the performance of GameStop Corp (NYSE:GME). and AMC Entertainment Holdings Inc.
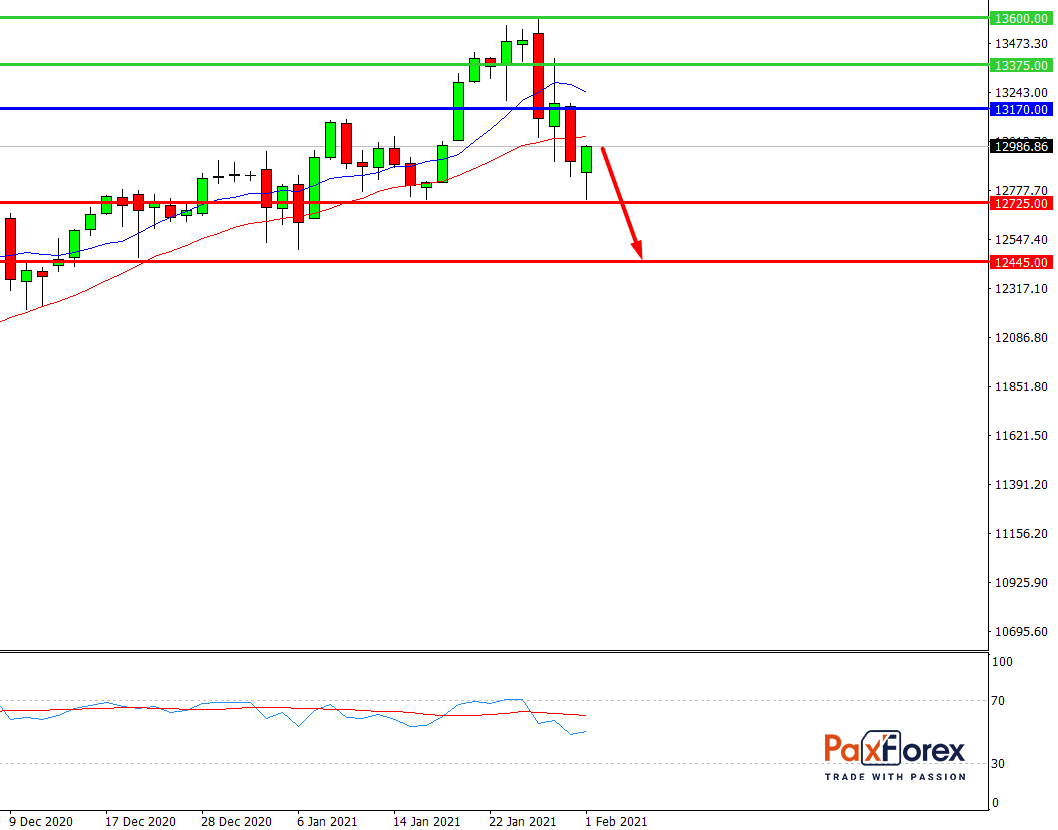
Nasdaq 100, H4

Pivot: 12885.00
Analysis:
Provided that the index is traded below 13170.00, follow the recommendations below:
- Time frame: H4
- Recommendation: short position
- Entry point: 12885.00
- Take Profit 1: 12725.00
- Take Profit 2: 12445.00
Alternative scenario:
In case of breakout of the level 13170.00, follow the recommendations below:
- Time frame: H4
- Recommendation: long position
- Entry point: 13170.00
- Take Profit 1: 13375.00
- Take Profit 2: 13600.00
Comment:
RSI indicates a downtrend during the day.
Key levels:
| Resistance | Support |
| 13600.00 | 12725.00 |
| 13375.00 | 12445.00 |
| 13170.00 | 12405.00 |
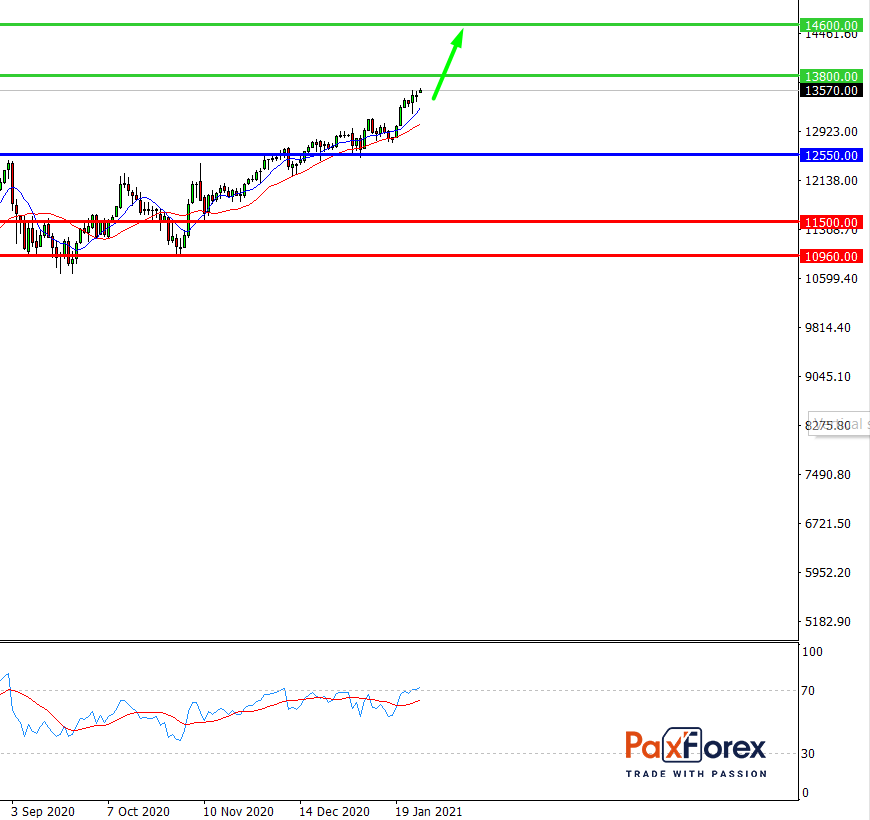
Nasdaq 100, D1

Pivot: 12990.00
Analysis:
While the price is above 12550.00, follow the recommendations below:
- Time frame: D1
- Recommendation: long position
- Entry point: 12990.00
- Take Profit 1: 13800.00
- Take Profit 2: 14600.00
Alternative scenario:
If the level 12550.00 is broken-down, follow the recommendations below:
- Time frame: D1
- Recommendation: short position
- Entry point: 12550.00
- Take Profit 1: 11500.00
- Take Profit 2: 10960.00
Comment:
RSI is bullish and indicates further increase.
Key levels:
| Resistance | Support |
| 15000.00 | 12550.00 |
| 14600.00 | 11500.00 |
| 13800.00 | 10960.00 |


